My coworker Abdulahi Osoble and I recently gave a talk at Droidcon NYC about how to use a design system to make building Server Driven UI easier. We go through the motivations and building blocks, along with architectural decisions that need to be made along the way.
The video is here, the slide deck is here, and the accompanying open source repository is here. The repository is my favorite part, since it showcases a fictional micro-design system running on multiple platforms, and showcases Server Driven UI working on all of these platforms with the same source json.
Not too long ago, I came across Kaushik’s blog post and repo about Kotlin scripting. Around the same time, I was trying to automate a process of cleaning up some images I had. Given a set of transparent pngs, I wanted to find out if the last line was a solid line, and, if so, and if nothing is touching that line, remove it. While typically, I turn to using Pillow and Python for image manipulation scripts, I decided to give writing a Kotlin script a try instead.
I wrote the script (using javax.imageio) and tested it and everything was great. I then proceeded to combine my Kotlin script with the shell to run it on the set of images like this:
# look at directories 351, 352, ... 360for i in `seq 350 360`; do DIR="/path/$i" cd $DIR
# we have 15 images in each directory, sub_image_0.png, sub_image_1.png, ...for j in `seq 0 14`; do IMAGE=sub_image_$j.png
kotlin /Users/ahmedre/Documents/code/kotlin/line_finder/finder.main.kts $IMAGE
done cd -
done
The script loops on a set of directories, each with a number, and on a set of 15 images inside that directory. For each image, I run the Kotlin script, passing it as a parameter. The surprise to me came when I found that running this took ~2.5 minutes! 150 images isn’t a massive amount, and these aren’t very large images, so why does it take so long?
KScript
At this point, I remembered having come across KScript at some point. It provides a wrapper around kotlinc, caching script compilation among other things. I replaced /usr/bin/env kotlin with /usr/bin/env kscript in the script, and replaced kotlin with kscript. This brought the time down to ~1 minute and 12 seconds.
I continued reading, after which I found that KScript has a package option used to deploy scripts as standalone binaries. I ran kscript --package finder.main.kts and took the finder.main binary and replaced it in the for loop above. This brought the time down to ~29 seconds.
Compiled Jar
Maybe it’s slow due to Kotlin Scripting, I thought. What if I make a compiled jar instead? I modified the script (adding a main method, etc), and used kotlinc to build a jar, using kotlinc finder.kt -include-runtime -d finder.jar to generate a new jar, and used java -jar finder.jar in place of the existing Kotlin command in the loop. Running this took ~28 seconds also.
This makes sense, since it seems that KScript is precompiling and caching the compiled script.
The Culprit
Bringing down the run to 28 seconds is great, but still felt way too long for a set of 150 images. As I was thinking about this while rerunning the script, I noticed something interesting - every few runs of the script, I’d get a dock icon in macOS, which would then disappear, followed by another one. This brought me to a realization - what if the reason this is so slow is that we are processing a single file per run, causing the jvm to spawn once for each image processed.
Going back to the original script and measuring the time of the entire method, I saw that processing an image takes roughly 75ms. Based on this, the expected time would be 75ms * 150 images =~ 11.25 seconds. Moreover, updating the initial shell loop to add a time in front of each run shows runs that are taking a bit longer (over 110ms) per run. The combined signal from these should have been enough to consider this optimization sooner.
What if we modified the script to run on each directory of images instead of on each image? I modified the script to handle a directory at a time, and re-ran the loop, without the inner loop from 0-14. The updated times were really surprising.
Running the Kotlin Script with kotlin: 15 seconds.
Running the Kotlin Script with kscript: 16 seconds.
Running the Kotlin Script with a packaged kscript: 10 seconds.
Running with a compiled Jar: 11 seconds.
The real issue here was the cost of starting up a jvm for each file. Partially combining the files (to do 10 jvm process starts instead of 150), brought the time from ~28 seconds, to close to 10 seconds (or, with a vanilla Kotlin script, from ~2.5 minutes to 15 seconds). Using this information, combining the 10 runs down to a single run by further modifying the code to support nested directories brings the run time down to ~1.5 seconds (compiled), or ~5 seconds using Kotlin scripting 1. Not bad!
An Untested Idea
Kotlin Multiplatform is very powerful, and provides us the ability to compile Kotlin for non-JVM platforms (by going through LLVM). KMP could easily allow us to take our script and compile it for non-JVM platforms, therefore making it native. In other words, given something like finder.kt, I could do something like:
# install kotlin-native - on macOS, we can do:brew install kotlin-native
# for the first time running kotlin-native on macOS, we'd have to clear the# quarantine extended attribute.xattr -d com.apple.quarantine '/opt/homebrew/Caskroom/kotlin-native/1.8.21/kotlin-native-macos-aarch64-1.8.21/konan/nativelib'/*
# now we can run it through the kotlin-native compiler# won't work if we have any java.* or android.* importskotlinc-native finder.kt -o finder
This would give us a native command line application, without the jvm. We’d expect the performance to be better than what we’ve seen so far, due to not going through the jvm. I didn’t test this approach, however, due to the fact that ImageIO is a jvm only construct. To do this, I’d have to use skia, or expect/actual methods for reading and manipulating pixels on the various platforms.
Takeaways
There are three key takeaways here:
I was again reminded that the adages of “Measure before optimizing,” and “Premature optimization is the root of all evil” are both true. Measure first, and it becomes clear where to spend time to get the most impact.
There is a cost to spinning up a jvm. Keep this in mind when writing Kotlin scripts.
Converting a vanilla Kotlin script to a native script is very compelling, and something I will consider in the future.
This is ~10ms per image, which is a lot less than the estimate of 75ms per image (since that 75ms was a measure of the entire execution). ↩︎
At KotlinConf this year, JetBrains announced that Compose for Web will be powered by WebAssembly. The example repository was very compelling, showing that a composable function can now be written on Android and shared across to iOS and web. I quickly got to work updating one of our internal projects to support this and was able to get it working fairly quickly. My coworker, Efeturi, said, “it’s nice but, too bad it’s still in alpha.” Little did I realize that trying to answer that simple comment would lead me to discovering something I never realized before - you can actually use the same Composable functions on the web today without WebAssembly (and thus without the alpha dependency).
But first, a bit of history…
History
In 2021, JetBrains announced a way to write Compose for the browser. This method, which allowed us to write Compose applications for web using something very similar to what we’d write using HTML and CSS, is now referred to as Compose HTML.
This is really powerful for people developing for the web. For everyone else, it’d be a lot more convenient to be able to use the same @Composable functions we wrote for Android or iOS on the web.
Versions of Compose for Web
While going through the example repository, I noticed that the web ImageViewer sample supported two platforms - WebAssembly and JavaScript. I asked about this on Kotlin Slack, and received an answer about this from Slava Kuzmich, who works on Wasm at JetBrains:
They both use Skia library compiled to WebAssembly. The difference is that js target compiles your Kotlin code to JavaScript, while wasm compiles Kotlin code to WebAssembly.
We have two versions of Compose:
“Compose for Web” is compatible with Android/Desktop/iOS but it doesn’t use HTML/DOM elements and renders everything on canvas using Skia.
“Compose HTML” is the older version that uses different HTML-like APIs to generate DOM.
We currently focus more on the canvas version.
Therefore, Compose Multiplatform actually supports 2 primary flavors of Compose - Compose HTML and Compose for Web (which can target JS or WebAssembly). The latter is multiplatform and relies on Skia for rendering. The former is only available for usage in Kotlin/JS.
Adopting Compose on the Web
It ends up being pretty straight forward to adapt Compose on the Web in an app. I adopted the code in the wasm example repository’s jsMain directory and Gradle files to replace Compose HTML in my PrayerTimes KMP Example repository with Compose for Web targeting JavaScript in this pr.
Note that the official example, while a great guide for getting things running on the web targeting both JavaScript and WebAssembly, only runs with WebAssembly as of the writing of this post (i.e. :webApp:wasmRun worked for me, but :webApp:jsRun does not).
While it seems that targeting WebAssembly will be the most future proof way to have Compose on the web due to its performance and some massive work around optimizing sizes by the teams, there are three reasons to target JavaScript in the meanwhile today:
it doesn’t need a dev version of Compose today
it works on more browsers without needing to set flags for GC, etc. It works on Safari, for example, which currently doesn’t support Kotlin/Wasm.
it’s easy to support wasm from this, as the official example shows.
Several people havealreadywritten about their journey migrating from Gson to Moshi. So why write this post? While migrating a fairly large project to Moshi, my team learned a few things (and came up with a few simple tools) that made it safer and easier to do this migration. Some of these points were either mentioned in passing in the aforementioned articles, or were skipped over altogether, and they are the focus of this post. Consequently, I’ll skip things like the motivation of moving to Moshi, since some of the aforementioned articles cover that pretty well.
A Quick Note on Gson’s field naming policy
One of the earliest concerns about migration is how to deal with Gson’s .setFieldNamingPolicy method, which allows the automatic mapping of something like created_at in json to createdAt in Java/Kotlin. One of the articles on this matter in specific that resonated with me when I read it long ago is Jesse Wilson’s article on naming conventions, which specifically addresses this point. Due to the arguments in that article, we decided to explicitly add annotations (@Json(name = "")) to the fields. While manually adding them is a lot of work, it can be done incrementally, and, as we discovered during the migration, it can help identify existing bugs that no one noticed before.
Overall Strategy
Moshi-Gson-Interop
Slack’s moshi-gson-interop is a useful tool for slowly migrating from Gson to Moshi. It tries to intelligently decide whether a particular model should be deserialized using Gson or Moshi, based on some heuristics (which one can optionally tweak if needed). One such heuristic is that classes that are annotated with Moshi’s @JsonClass are given to Moshi to deserialize.
There’s also a logger parameter that lets us tell the library how to log various events.With this, we can easily watch logcat (for example) to know which classes are deserialized by Gson and which by Moshi and annotate more classes until the entire payload of a particular screen is all deserialized via Moshi.
Notice the nice property allowing us to gate this feature to a subset of people and safely continue using Gson while we build trust in our migration. This helps us stage our migration in a (mostly) safe and iterative manner.
Migration Strategy
At a high level, the migration strategy we used went a bit like this:
choose a screen to migrate.
enable moshi-gson-interop.
run the app, go to the screen, and see what is still being deserialized by Gson.
iteratively add annotations to models until the entire screen is deserialized via Moshi.
run some runtime validations to ensure results are properly deserialized.
fix issues found from validations.
repeat.
As mentioned above, moshi-gson-interop makes it easy to toggle this feature to make this migration incremental. Initially, for example, only a single developer might enable interop. Once a critical mass of screens has been migrated, we might enable this for all engineers, and only start rolling it out to employees after we’ve gained enough confidence on it.
Validation and Other Useful Tools
Since most of our network calls use Retrofit, we wanted to build something for testing purposes to help us validate the correctness of the json data. Retrofit allows us to add a Converter.Factory while initializing it. Typically, this is the in-built GsonConverterFactory.create(gson) instance, for example. We can choose to either replace (or wrap) this instance to do some neat things.
For validation, for instance, we use a Converter.Factory that deserializes the data twice - once in Gson, and once in Moshi, and compares the outputs. This should only be used for development, since it’s very inefficient (both due to the double deserialization of the payload, and the one-shot reading of the entire response body). This looks something like this:
classGsonMoshiValidationConverterFactory(
privateval gson: Gson,
privateval moshi: Moshi
) : Converter.Factory() {
overridefunresponseBodyConverter(
type: Type,
annotations: Array<out Annotation>,
retrofit: Retrofit
): Converter<ResponseBody, *>? {
return InteropConverter<Any>(type, gson, moshi)
}
// TODO: override requestBodyConverter here if needed for migration
// in a similar way to what we did for the response body above. We'll
// need to write another Converter that takes the actual value and
// converts it to json, once for Moshi and once for Gson. Because the
// field ordering maybe different, we can do validation by converting
// the json strings back to objects and comparing the objects.
}
classInteropConverter<T>(
privateval type: Type,
privateval gson: Gson,
privateval moshi: Moshi
): Converter<ResponseBody, T> {
overridefunconvert(value: ResponseBody): T? {
// WARNING: This is very inefficient, do NOT use this outside of development
val bodyAsString = value.string()
val moshiResult = try {
val adapter = moshi.adapter<T>(type)
adapter.fromJson(bodyAsString)
} catch (exception: Exception) {
// handle parsing exception via Moshi
}
val gsonResult = gson.fromJson<T>(bodyAsString, type)
if (moshiResult != gsonResult) {
// flag mismatch between Moshi and Gson
}
return gsonResult
}
}
Using this, we can clearly flag cases where Moshi and Gson deserialize something differently and can work to fix it. In order to work, however, the caveat is that the types being compared need to properly have an implemented .equals methods. One nice side effect of this is that whenever a particular item mismatches, we can also get the body as a string, and write a small validation unit test to iron out the cases.
This same trick of rolling our own Converter.Factory is useful for other things also, such as for very roughly measuring the performance of deserialization in Moshi versus Gson, and for surfacing exceptions at parsing time that are swallowed somewhere in the upstream code.
Note that if json is being sent, we should also override requestBodyConverter in the Converter.Factory similar to what we did for the rsponseBodyConverter. In this method, we can then convert the object to json for both Moshi and Gson. Note that if we compare them at this time, we’ll get a lot of noise due to the ordering of the fields being different. To work around this, we can re-serialize the json back to the type again, and check equality after the round trip.
Gotchas
While developing, we ran into several interesting problems and issues that we’ll go over here. Many of these are arguably working around bugs on the backend, and often times, the right solution to these problems is to reach out to the backend team to fix the result instead of working around it on mobile.
Sealed Classes
For sealed class hierarchies, we used moshi-sealed. Under the hood, moshi-sealed will create a PolymorphicJsonAdapterFactory, which will decide the flavor to create based on the parameter type. In case of an unknown type, a fallbackJsonAdapter can be passed in. One known issue is that if the backend sends no type (i.e. the field is absent), Moshi will throw an exception. This can likely be worked around with a custom JsonAdapter if necessary, but it would make more sense to ask backend to properly send a type in this case instead.
Handling Alternate Keys
There are some scenarios where a payload will have a field coming back with any one of several json fields, such as in this example:
In this case, the actualName field in our Person object should contain whichever the server sent back of name or full_name. One approach for solving this is mentioned in one of the articles mentioned earlier, but that approach doesn’t work well when the model has many fields (since it would otherwise result in a lot of duplication just for mapping).
When it wasn’t easy to use the above approach, we opted to take what we thought would be an easier approach to this. Note that the below code has a bug, we’ll get to that after:
dataclassPerson(
val name: String?,
@Json(name = "full_name")
val fullName: String?
) {
// WARNING: This is actually wrong when using Gson and will result in a null
// value of actualName, even if one of name or fullName are passed in.
@Transientval actualName = (name ?: fullName)!!}
We figured we’d make all the different names as nullable variables, and knowing that the backend will always return one, we force our result to be whichever one of those fields is non-null. Note that, without the @Transient, Gson will try to look for an actual_name in the json to set this to.
While this works well for Moshi with codegen, this doesn’t actually work for Gson (when the type doesn’t use a type adapter), where actualName will return null, irrespective of the value of name or fullName. This happens to be a side-effect of how Gson makes these values via reflection.
If we look at the decompiled bytecode for our Kotlin data class, we can see that this variable gets set as part of the constructor:
Looking through theseposts on StackOverflow, we find out that the reason is that without a custom deserializer, Gson uses Unsafe.allocateInstance to make an instance reflectively, bypassing the constructor. It reflectively sets the properties afterwards, resulting in our actualName never being set. To fix this, we can just change actualName to a getter instead:
dataclassPerson(
val name: String?,
@Json(name = "full_name")
val fullName: String?
) {
val actualName: String
get() = (name ?: fullName)!!}
Handling non-nullable Primitives
Suppose we had a model with:
// case A
dataclassWidget(identifier: Int)
// case B
dataclassWidget(identifier: Int = 0)
In case A, if no identifier is set in the json, the Gson result would set it to 0, whereas the Moshi result would crash due to the field being missing. We can fix this by updating to case B, where we set a default value.
What if the json contained an identifier set to null? We’d expect the value to be defaulted to 0, and, in Gson, it is. However, in reality, this throws an error instead. While there are some suggested solutions in this thread about working around this, we opted for a similar approach to the above:
dataclassWidget(
@Json(name = "identifier")
@SerializedName("identifier")
internalval internalIdentifier: Int?
) {
val identifier: Int
get() = identifier ?:0}
One interesting note is that if the default in case B is not 0, Gson will still default to 0, which should make sense considering the note in the alternate keys section above.
Summary
This article offered a set of suggestions to make the migration from Gson to Moshi easier. By making the upgrade incremental, toggleable, and able to be validated, we make the migration a lot more achievable.
A little over a year ago, I gave a talk about building a PrayerTimes mobile application for iOS and Android using Kotlin Multiplatform some time ago. I recently gave a second talk about expanding this application to run on a plethora of other platforms (desktop, web, macOS, Linux, watchOS, iOS using Compose). You can watch it here and see the code on GitHub.
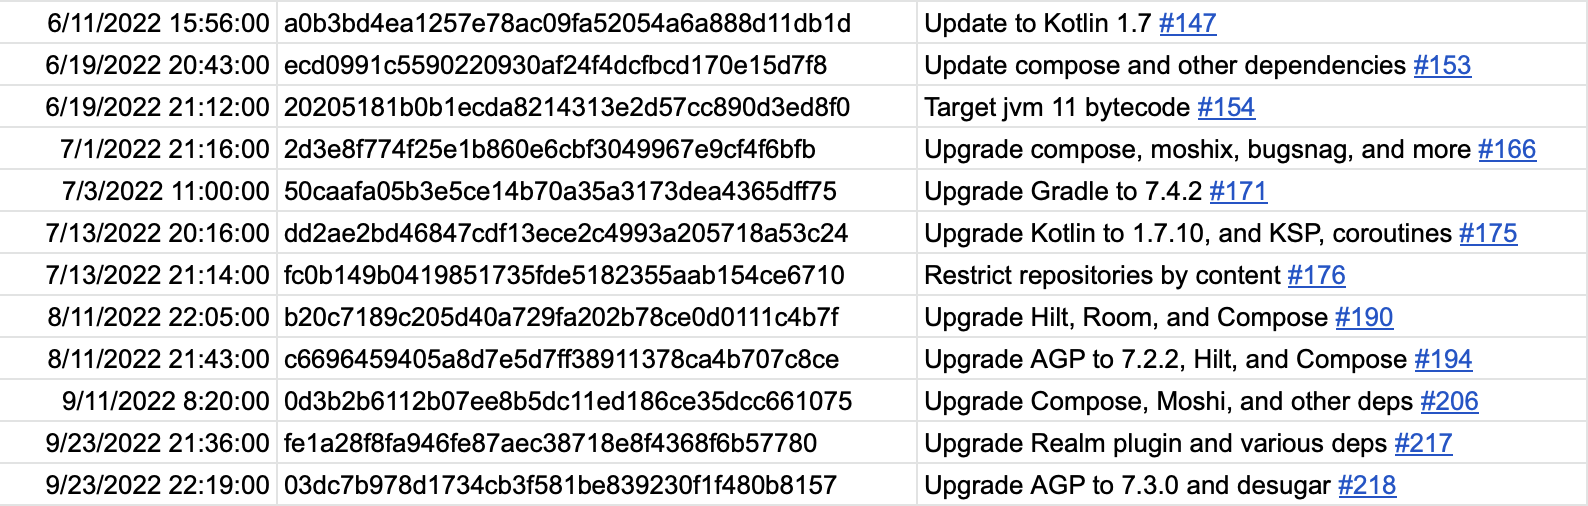
In a previous article, I talked about writing profiler-util, a tool I open sourced for visualizing build performance over time for personal projects (it interops the files generated by gradle-profiler and uploads the data to a Google Spreadsheet, along with providing tools for detecting regressions).
I typically run gradle-profiler on my personal projects every handful of PRs, especially those that I expect might affect build speeds (Gradle plugin versions, AGP versions, compiler plugins, etc).
The scenarios file I use for gradle-profiler consists of a number of
cases, including abi and non-abi changes to app and non-app modules, changing
resources, adding a composable function, clean builds using build cache, and
configuration (see this page from the Android developer documentation and
the gradle-profiler readme for more details).
A Mysterious Situation
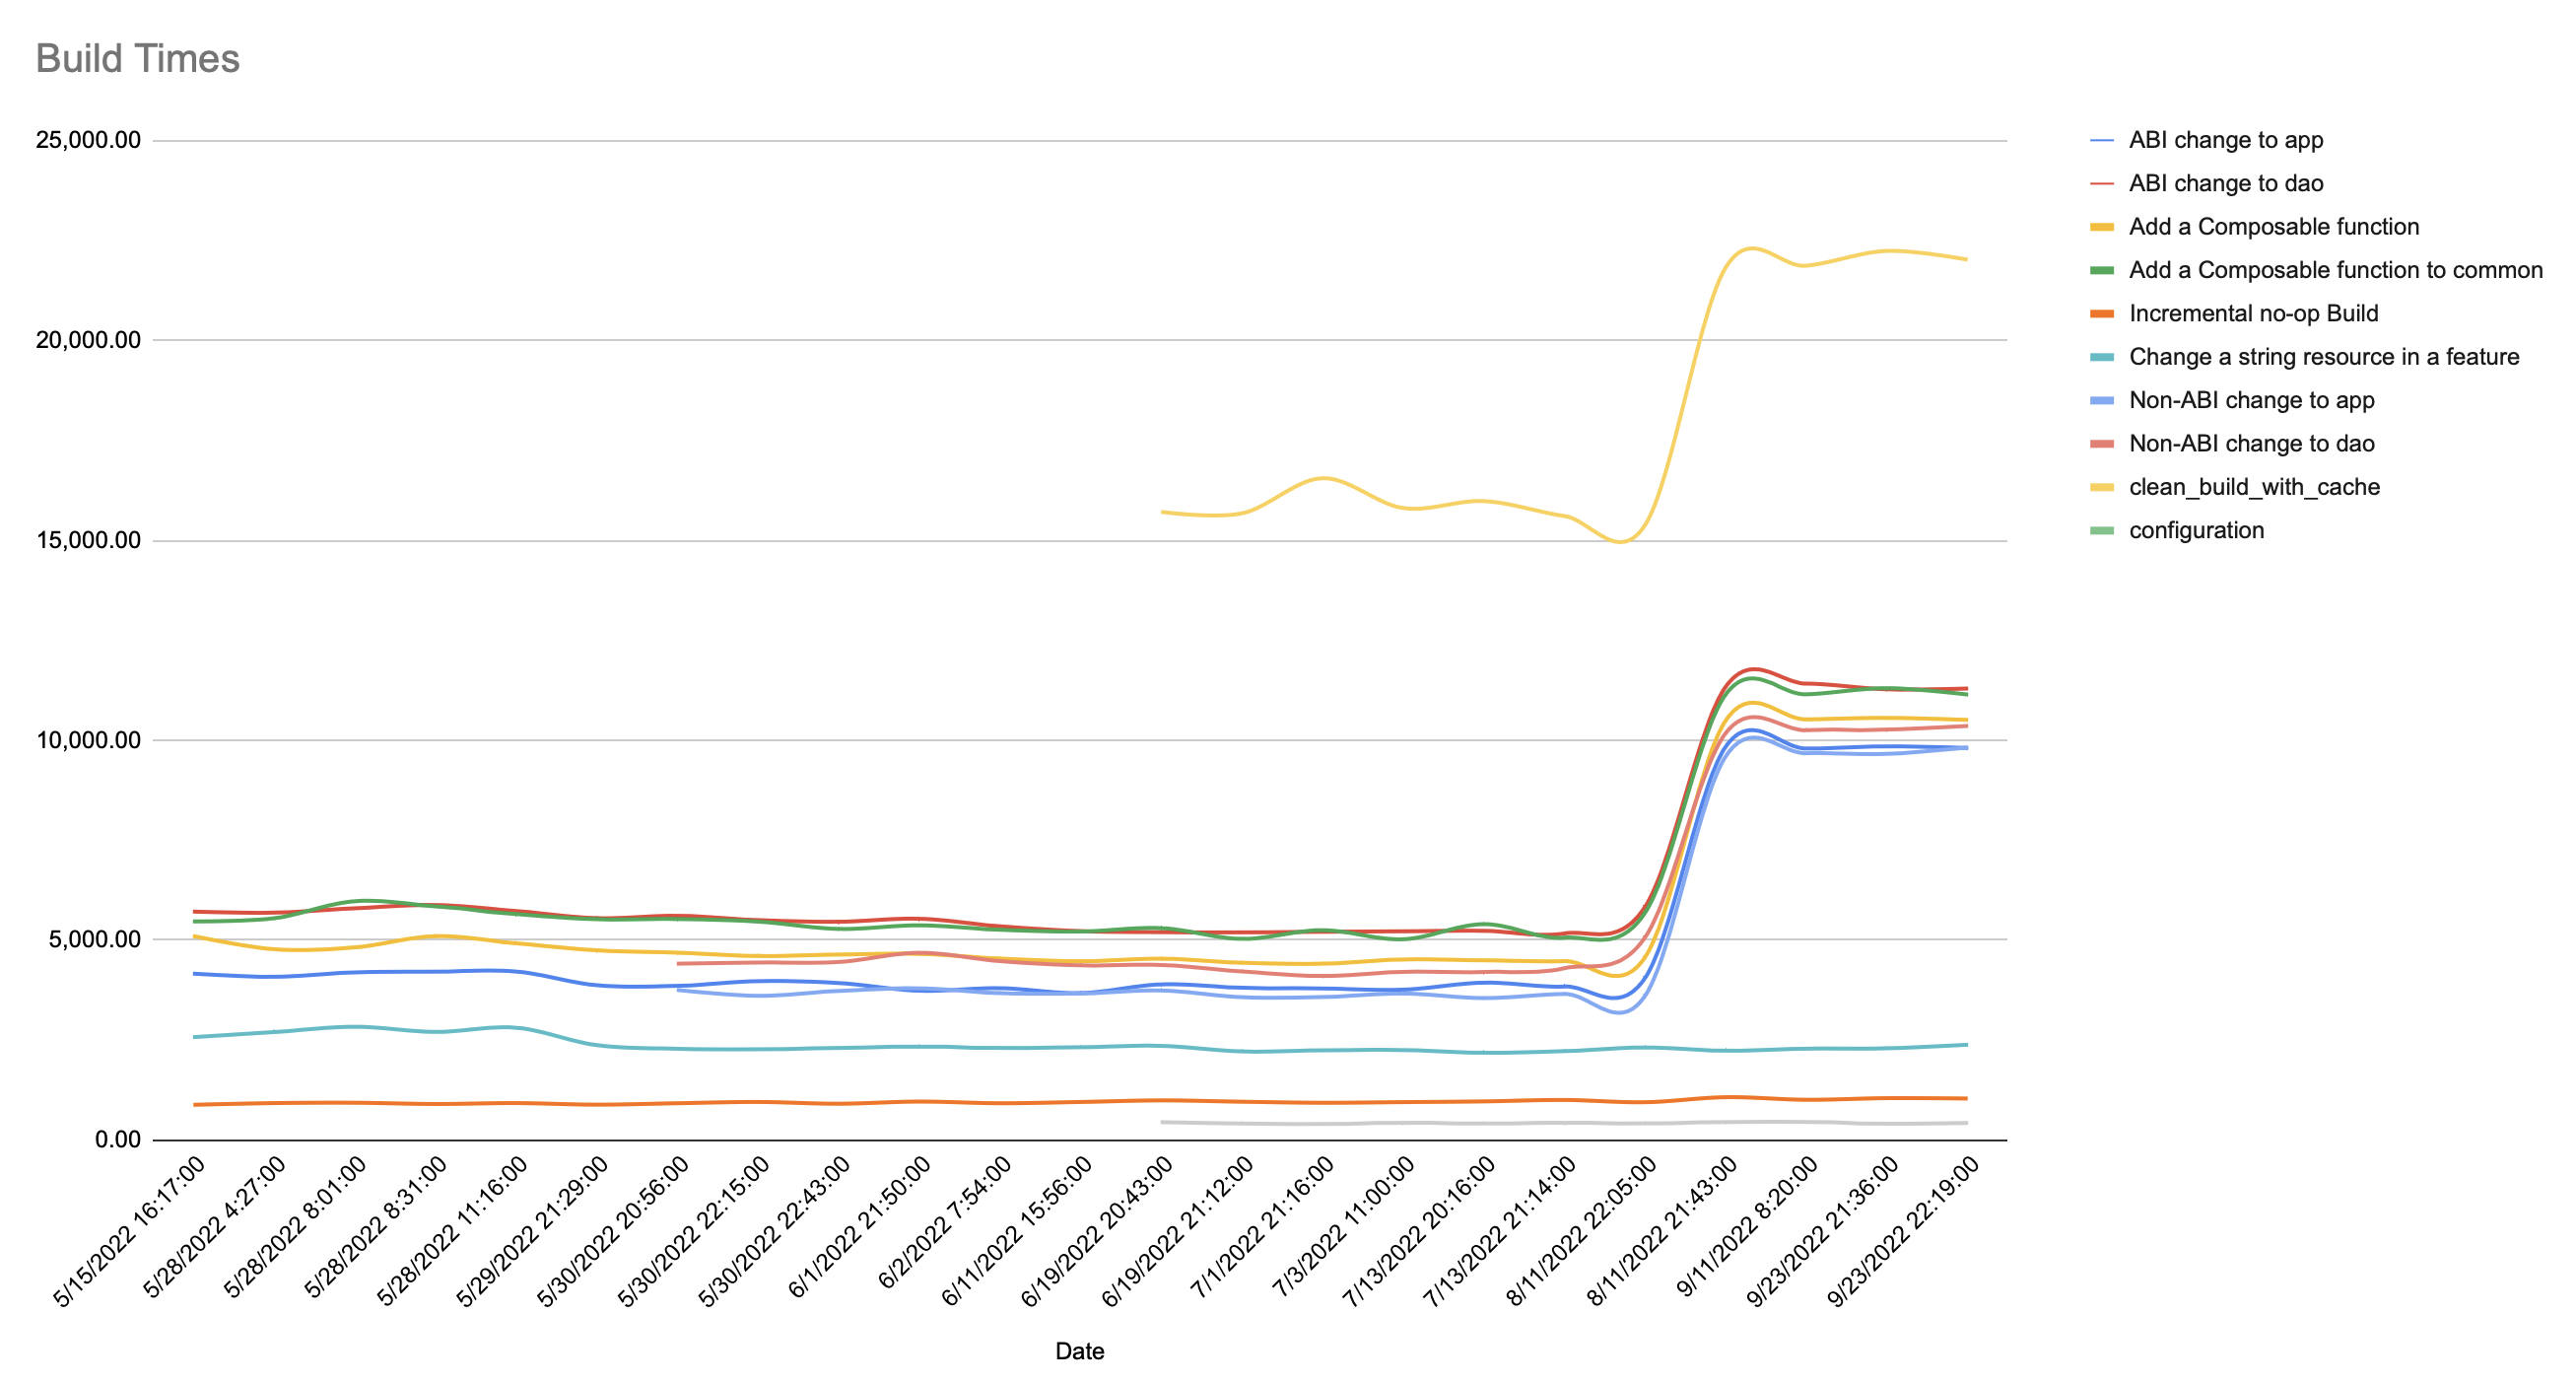
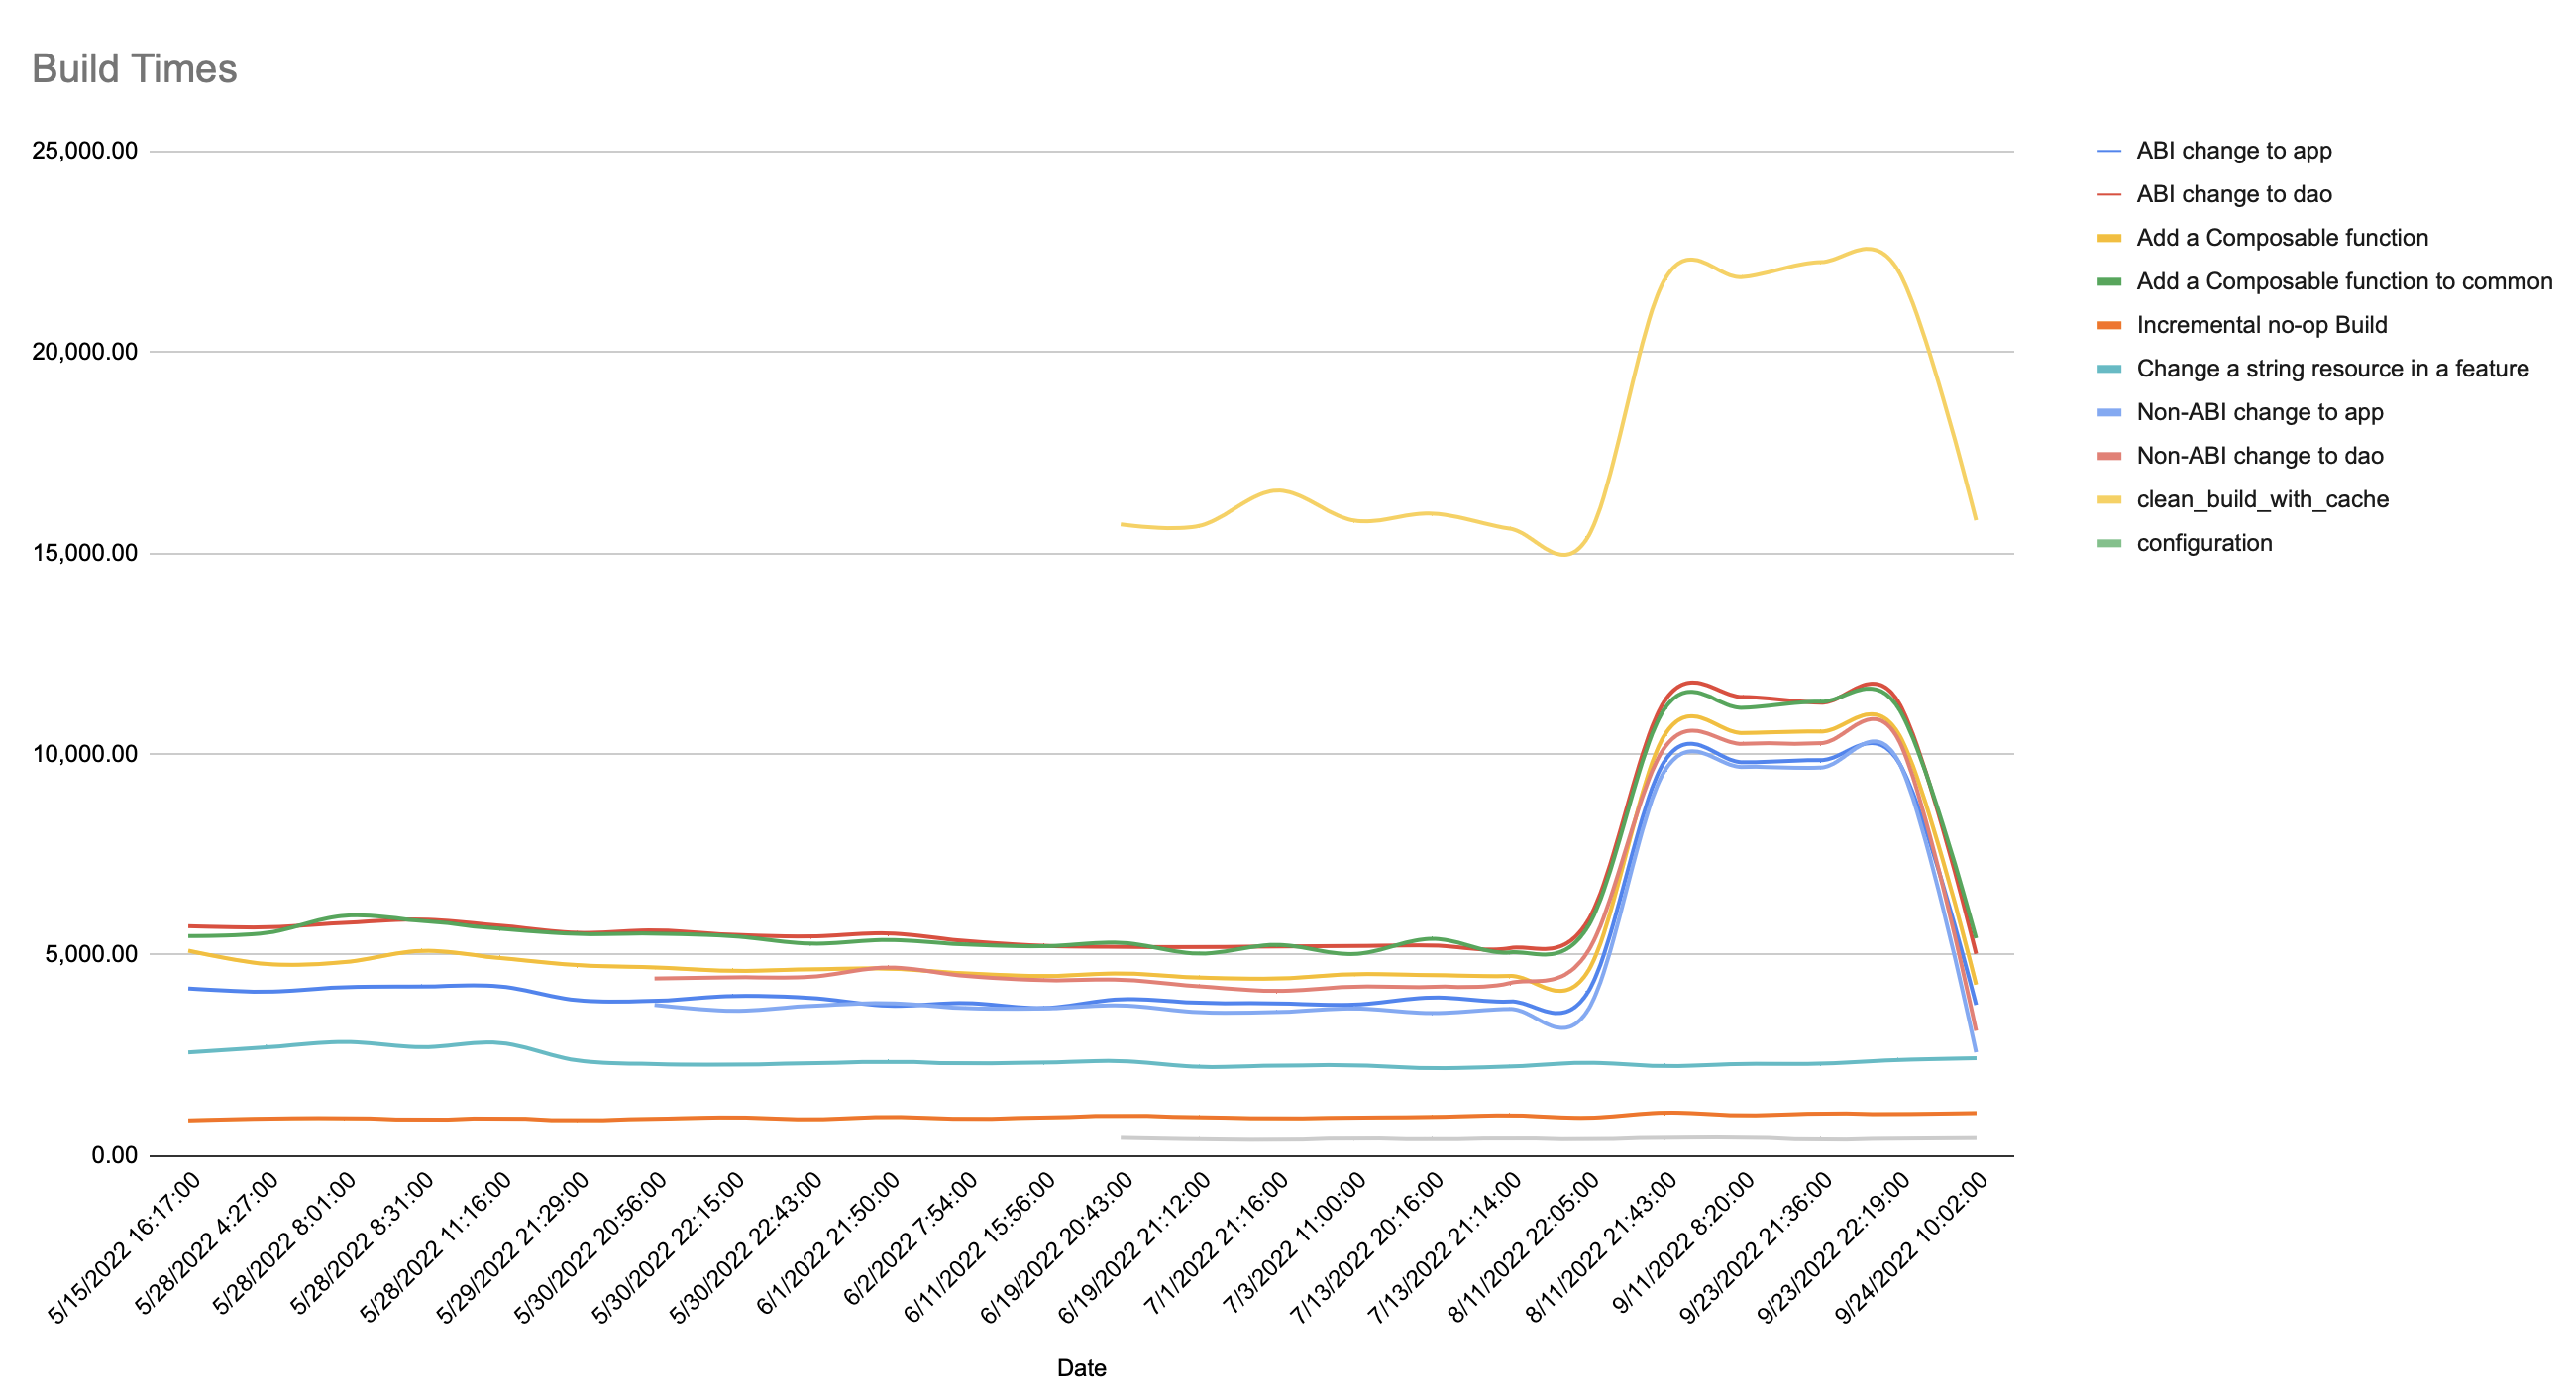
Recently, I checked to see how the build performance for my app was doing, and
was surprised to see this:
Looking closer, I could see the times greatly increasing for all but 3 metrics - configuration change, the change of a resource, and an incremental build without having changed any code. Given this, I looked and found that the change was upgrading AGP from 7.2.1 to 7.2.2 in this project. Surprised, I checked my other projects, and none of them had the same issue. A few weeks later, when I upgraded to AGP 7.3.0, the build times still didn’t improve, which surprised me.
I decided to look into this to try to figure out what was happening.
Thinking about Potential Explanations
Given that this was only happening in this project and none of my other projects, I decided to look into one of the following initial potential explanations:
Maybe nothing was wrong and re-running the test would fix the issue.
Gradle configurations across the profiler are different than those in real
life - maybe there is no regression at all and is just a case of mismatched
properties?
This project uses Realm, whereas none of my other projects do. Could
this be related?
Going through these quickly:
I re-ran the test multiple times on the commit with AGP 7.2.1 and the commit with the single change to AGP 7.2.2 and got consistent results every time. So much for that idea.
I chose one of the cases above, clean_build_with_cache, and ran it without gradle-profiler (./gradlew clean; ./gradlew assembleDebug) with AGP 7.2.1 and again with AGP 7.2.2 to eyeball the results - once again, they seemed consistent with the profiler results, thus removing the mismatched properties as an explanation.
An update to Realm happened recently and it unfortunately didn’t change the numbers at all. Moreover, no upgrade to Realm had happened in the window before the upgrade.
Finding the Issue
Given that none of the above worked, I decided to try something else that
ultimately lead me to the problem - I ran the above clean_build_with_cache
commands locally with --profile for both AGP 7.2.1 and AGP 7.2.2:
git checkout <last commit with 7.2.1>
# warm up caches, etc due to AGP version change to 7.2.1./gradlew clean
./gradlew assembleDebug
./gradlew clean
./gradlew assembleDebug --profile
git checkout <first commit with 7.2.2>
# note that profile html output files survive gradle clean# warm up caches, etc due to AGP version change to 7.2.2./gradlew clean
./gradlew assembleDebug
./gradlew clean
./gradlew assembleDebug --profile
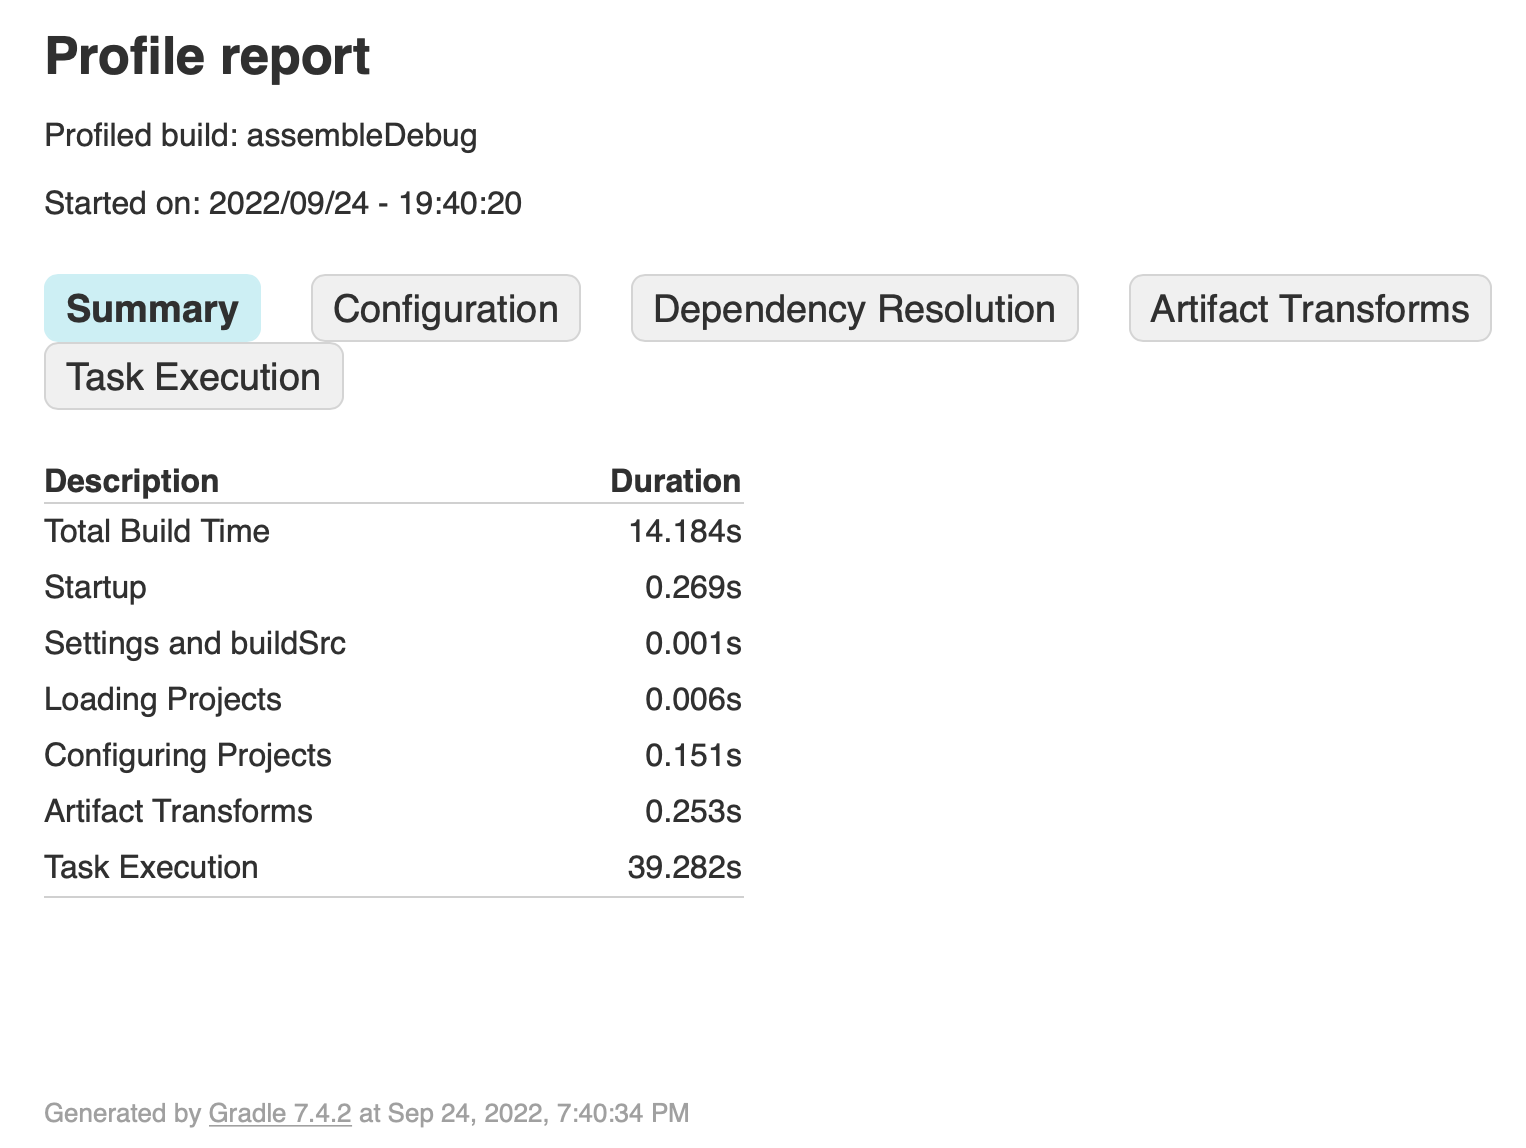
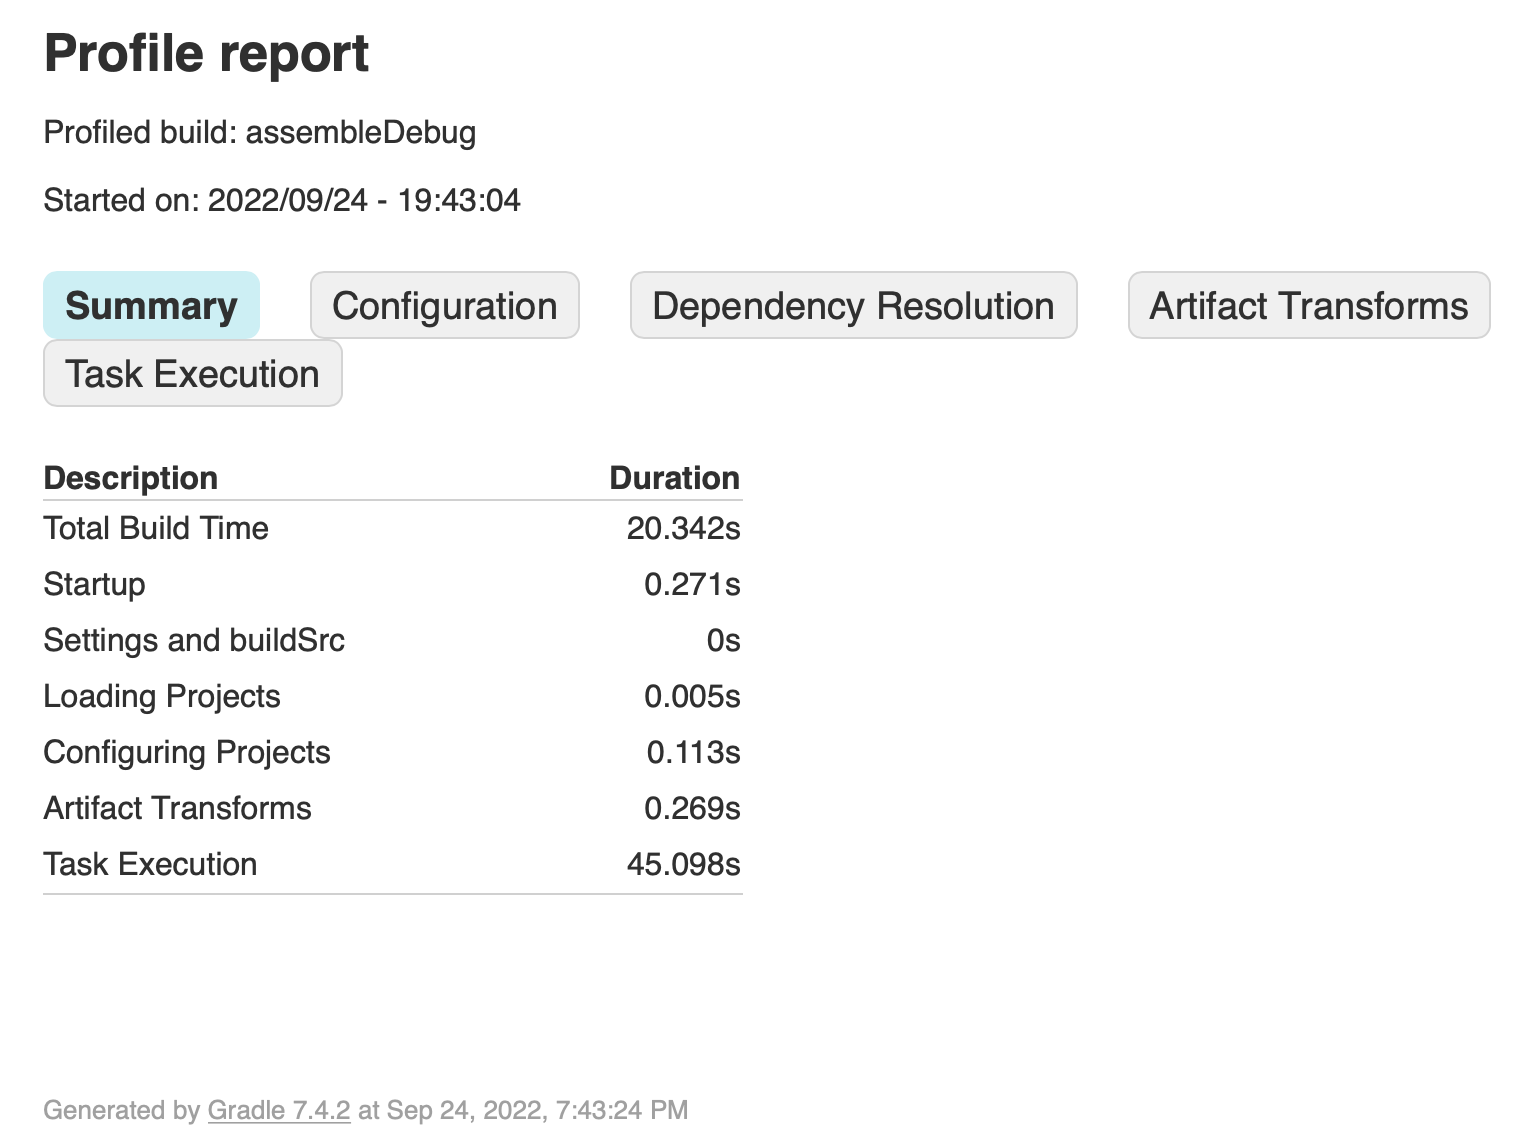
I then compared the result files:
The delta in build times is the only thing that stands out. Going through the configuration, dependency resolution, and artifact transforms tabs, nothing stands out and all numbers are close to each other.
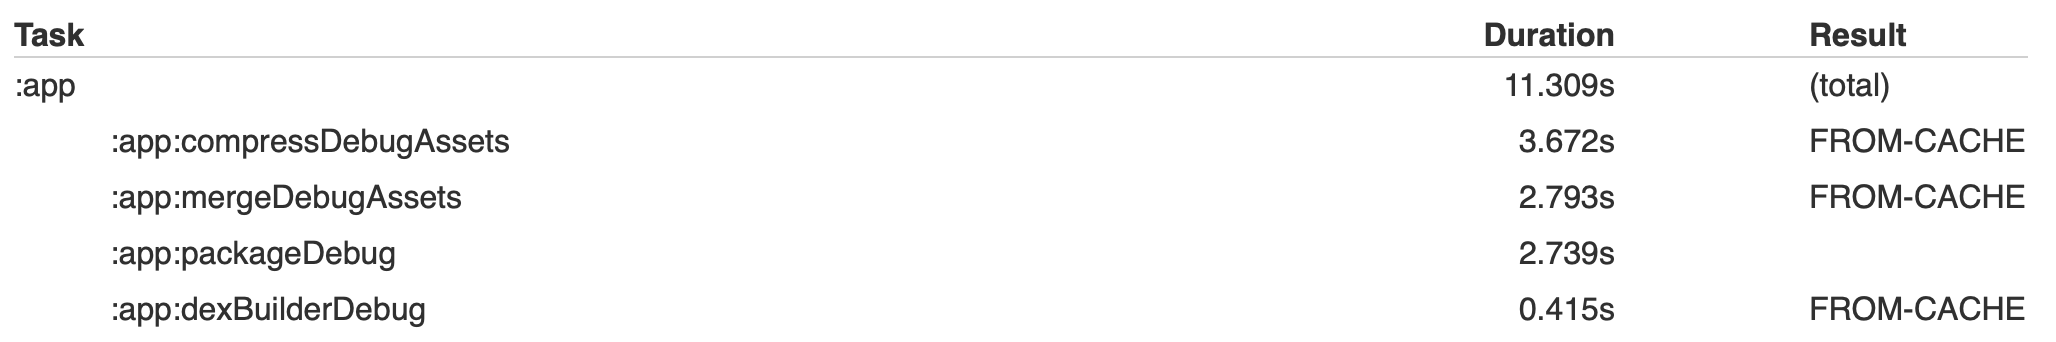
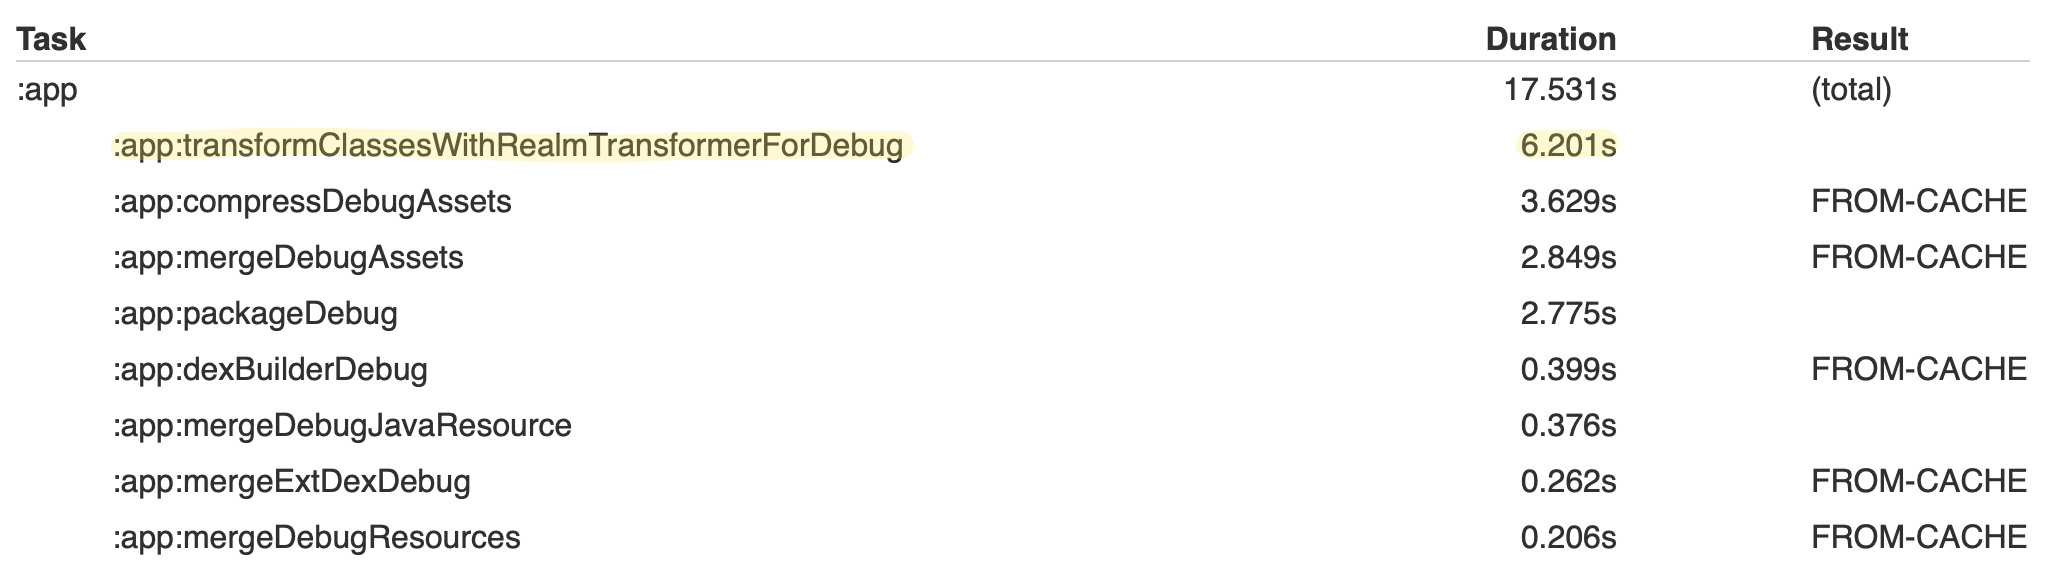
This leaves the task execution tab, which shows us something interesting:
Why is Realm taking 6 seconds when using 7.2.2 but not when using 7.2.1? And what’s Realm’s processor doing in app?
The Culprit
Realm objects have various annotations (@RealmModule on module classes, @PrimaryKey for primary keys, @Index for indices, etc), and requires an annotation processor, bundled within a realm-android plugin.
Historically, I had all said annotated classes in a separate, standalone module just for Realm models, since I know they’d rarely change and I didn’t want to pay the price of said processor every time. This is a good optimization in said cases.
Indeed, looking at app/build.gradle, I found the realm-android plugin in use there. So how did it get to app? Apparently, sometime back in May of 2016, io.realm imports were not resolving in the app module anymore (by not resolving, I am guessing this was in the IDE and not actually at compile time, though today, I have no way of being sure).
Removing the realm-android plugin brings back the compilation times to what they were before AGP 7.2.2 and above. This, however, doesn’t explain what AGP 7.2.2 had to do with this.
Warning - this is purely speculation at this point, and I am not certain about
anything else in this paragraph. Looking at the release notes for 7.2.2, there are only 2 fixes there. One of them is this one, which has to do with fixing a bug related to the transform API when used with the ASM api. ASM is used for bytecode manipulation, and is in use by realm-android. I suspect that this bug caused the plugin to do nothing in app (which was fine since it’s technically not needed as mentioned above). The bug was introduced in 7.2 alpha, and wasn’t fixed until 7.2.2. The first commit in my profiling was using 7.2.0, so I never noticed any “improvement” between 7.1.x and 7.2.x, only to see it being lost again in 7.2.2. This is, however, only a guess.
Wrapping Up
Some takeaways here:
Monitor your build times - the results may be quite surprising.
gradle-profiler is your friend.
the --profile flag is your friend.
If none of this had worked, I would have resorted to running a build scan next.
As an Android code base grows and has increasing code churn, unused resources are very likely to exist. While Android Studio has an option for cleaning up and removing unused resources, there are some reported bugs in this functionality that are still not fixed.
I started searching for another solution for finding and cleaning up unused resources in Android projects. I found this project, which has some Python 2 scripts to directly manipulate resources. Since it hadn’t been updated since 2018, I took the liberty to build something based on it, which fixes some of the issues I ran into while using it.
Introducing resource-cleanup - an open source project to help identify and clean unused resources (in retrospect, I wish I had named it “Mr. Kaplan”). It relies on severalopen sourcetools and heavily relies on the command line to accomplish its role.
The project has a set of shell scripts - one per resource type. It searches for usages of @[resourceType] or R.resourceType references. In the absence of these, it removes the given resource. The shell scripts take a single file and checks for usages accordingly. The documentation gives examples of how to combine this with tools like fd and shell loops.
These scripts have proven invaluable to us at work and helped us reduce our apk size by a sizable amount. Please give it a try!
I gave a talk at The Assembly in Dubai about tips and tricks for productively building mobile applications. In it, I discuss experimentation, catching issues earlier in CI/CD, multiplatform, and various other topics. Here are the slides.
Monitoring Gradle Build Speeds for Smaller Projects
Today, there are manygreatarticles and videos about how to optimize Gradle performance for Android builds. Larger companies watch these metrics closely, since build time translates into money. These twocomics sum up the situation pretty nicely.
I write and maintain several of my own Android applications. This got me to thinking about my own app build times. I started off using the gradle profiler, as recommended by many of the aforementioned articles and videos (this article gives a nice introduction on how to use the gradle-profiler in the light of Android apps).
Having a way to measure is great, but how do I know how my build times are doing over time? I wrote and open sourced profiler-util, a Kotlin app, for just this purpose.
Visualizing Build Performance over Time
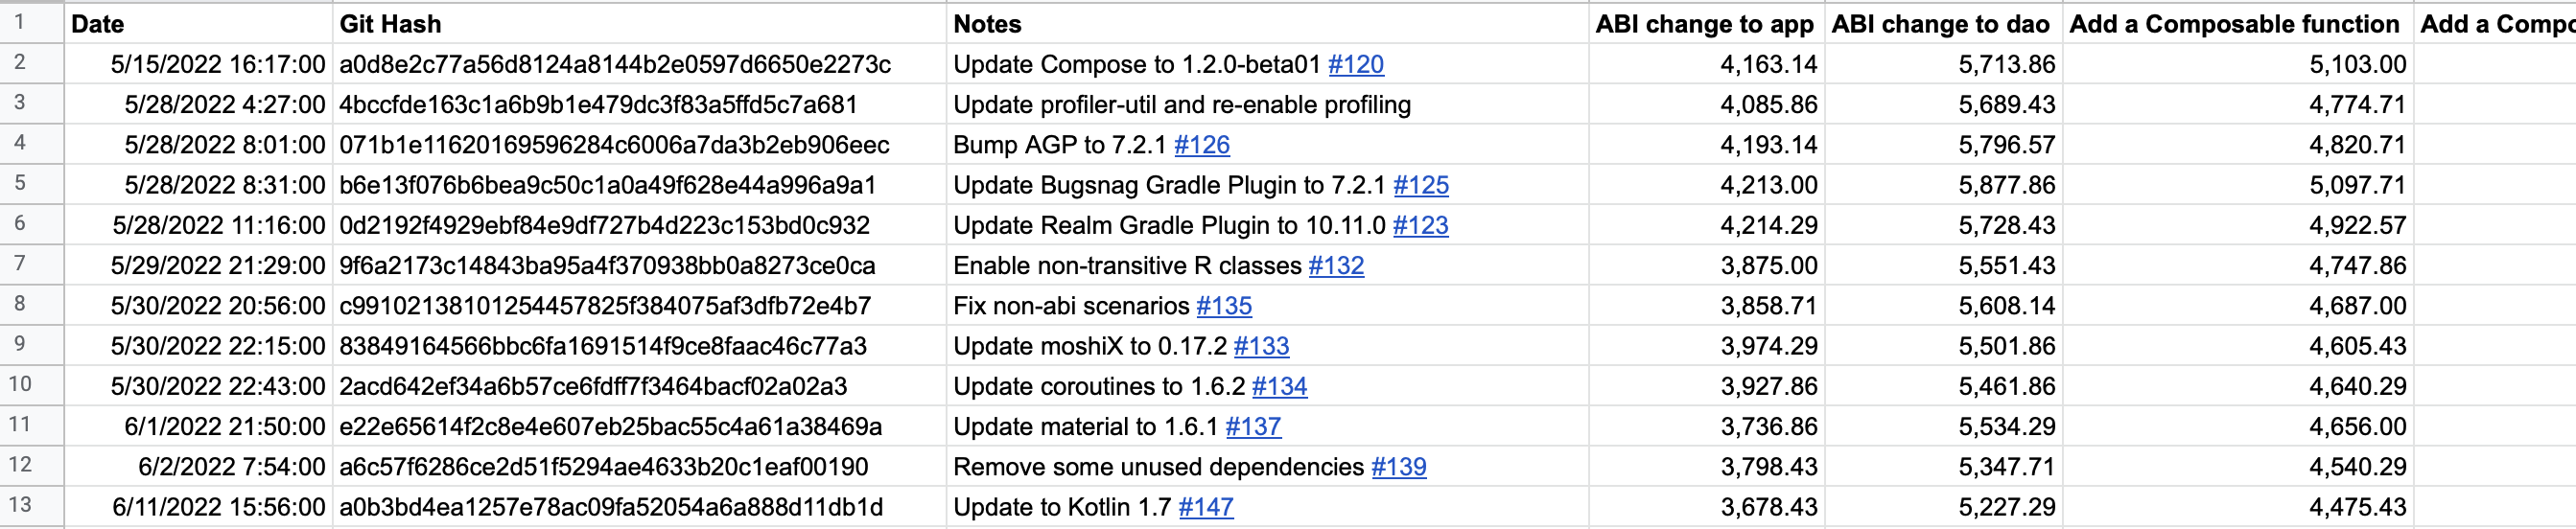
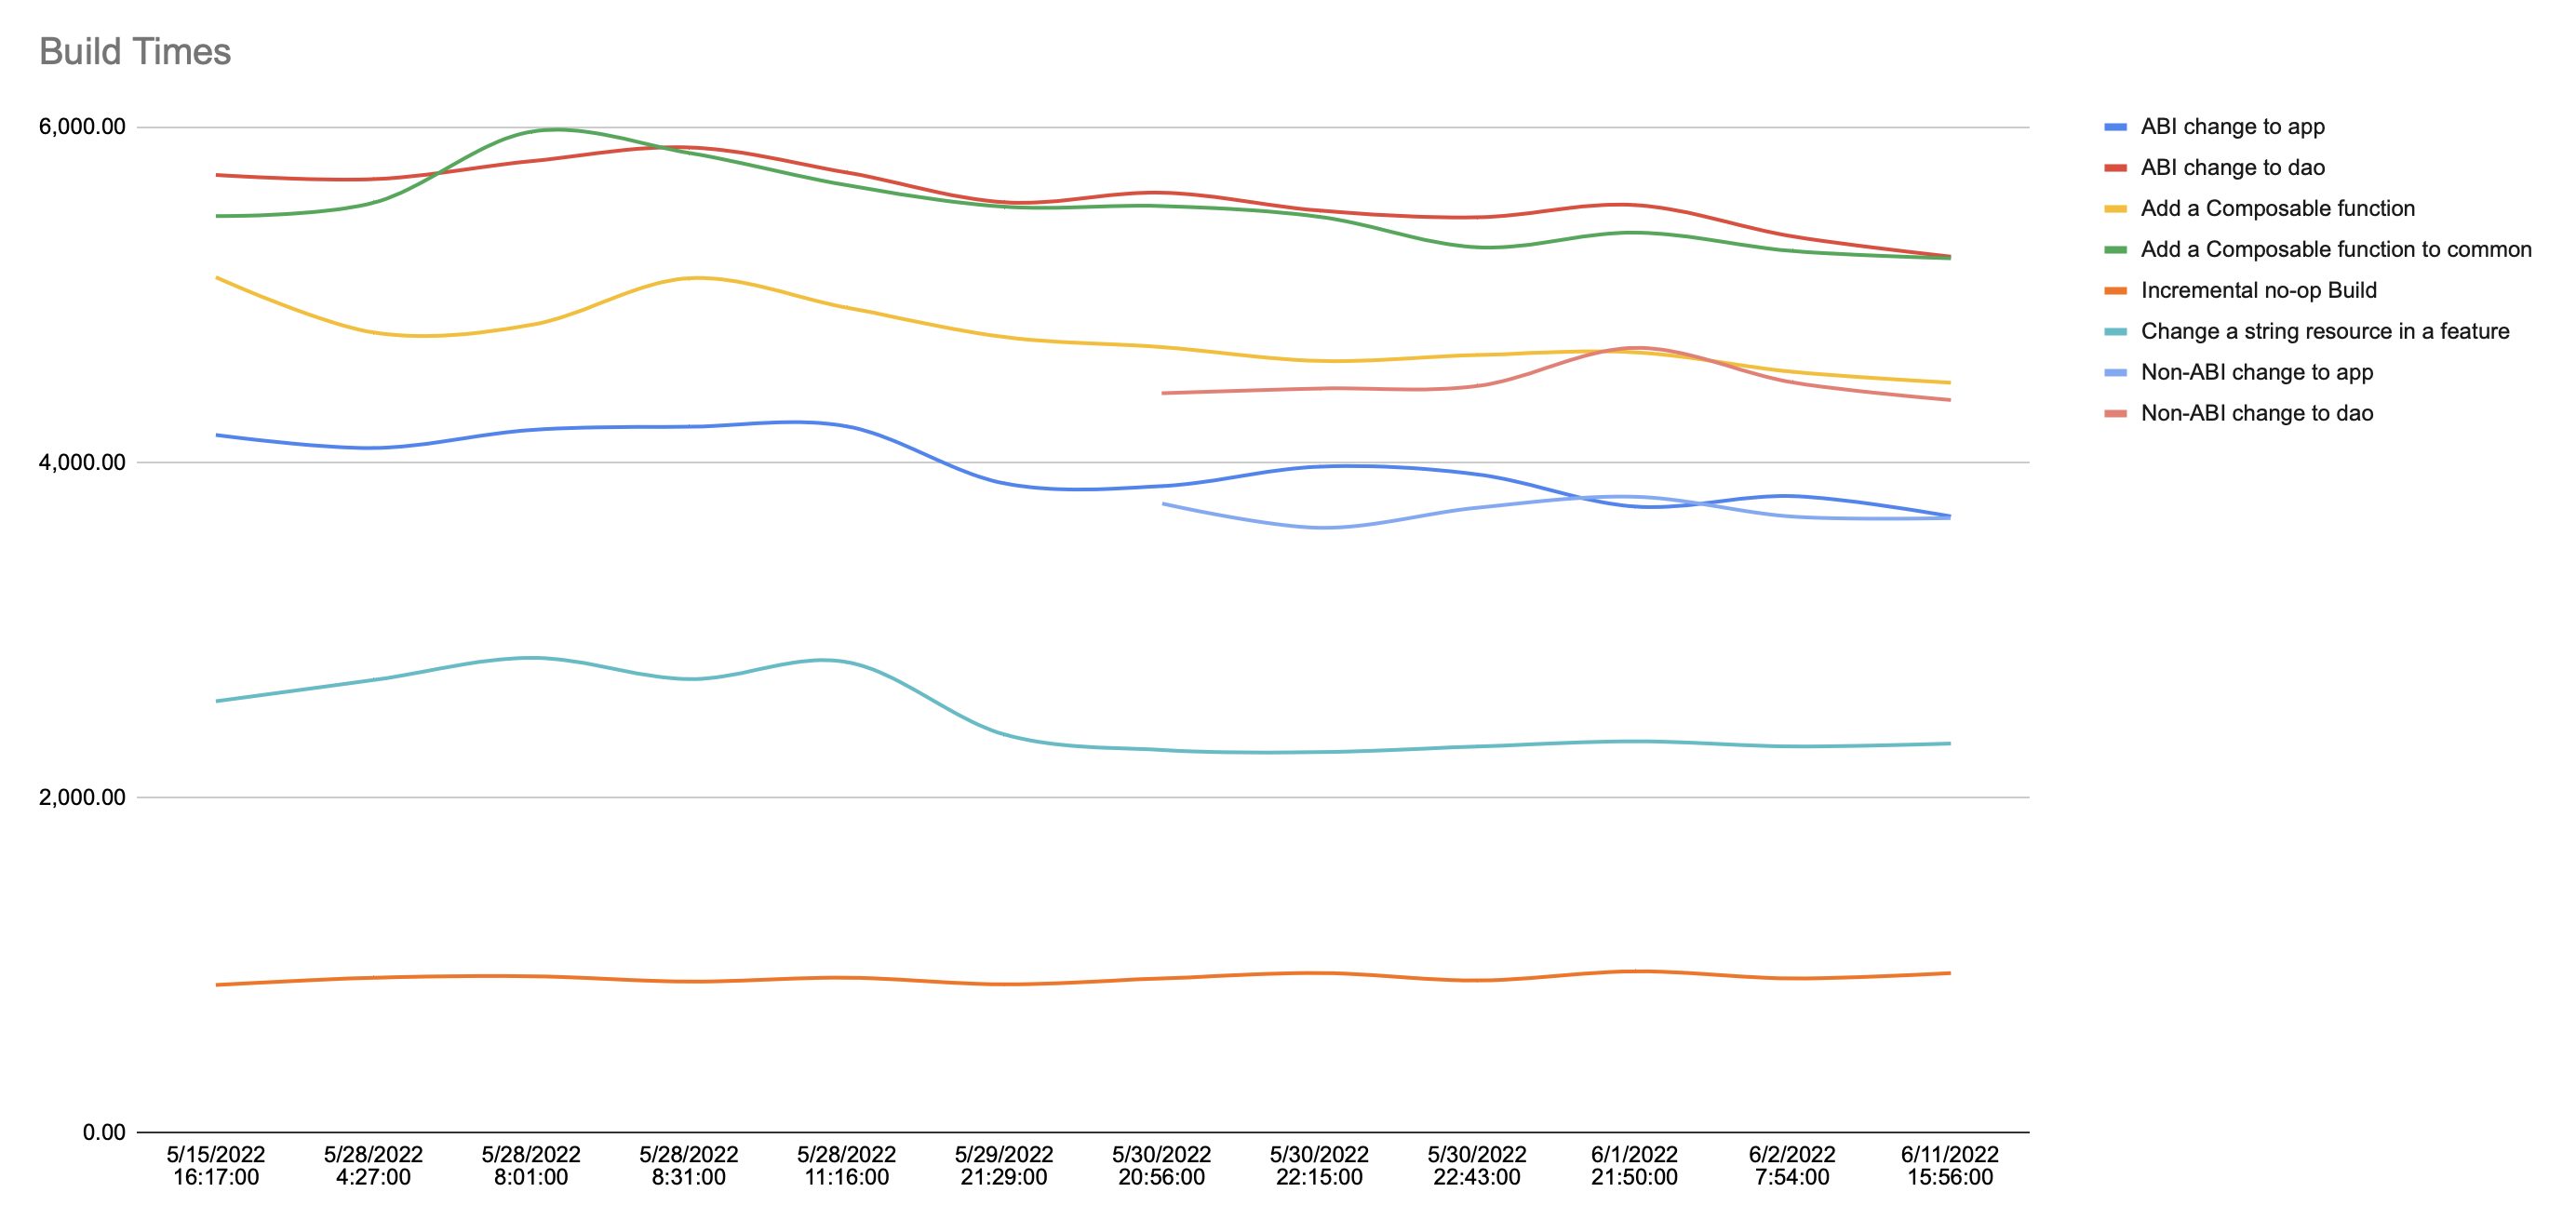
After running a gradle-profile, one of the outputs is a benchmark.csv file with the format. The tool I wrote has two modes - the first uploads the results from the benchmark.csv file into a Google Sheets spreadsheet.
What’s nice about using Google Sheets is that we also get graphing out of the box:
Note that the incomplete lines are benchmarks I added later on.
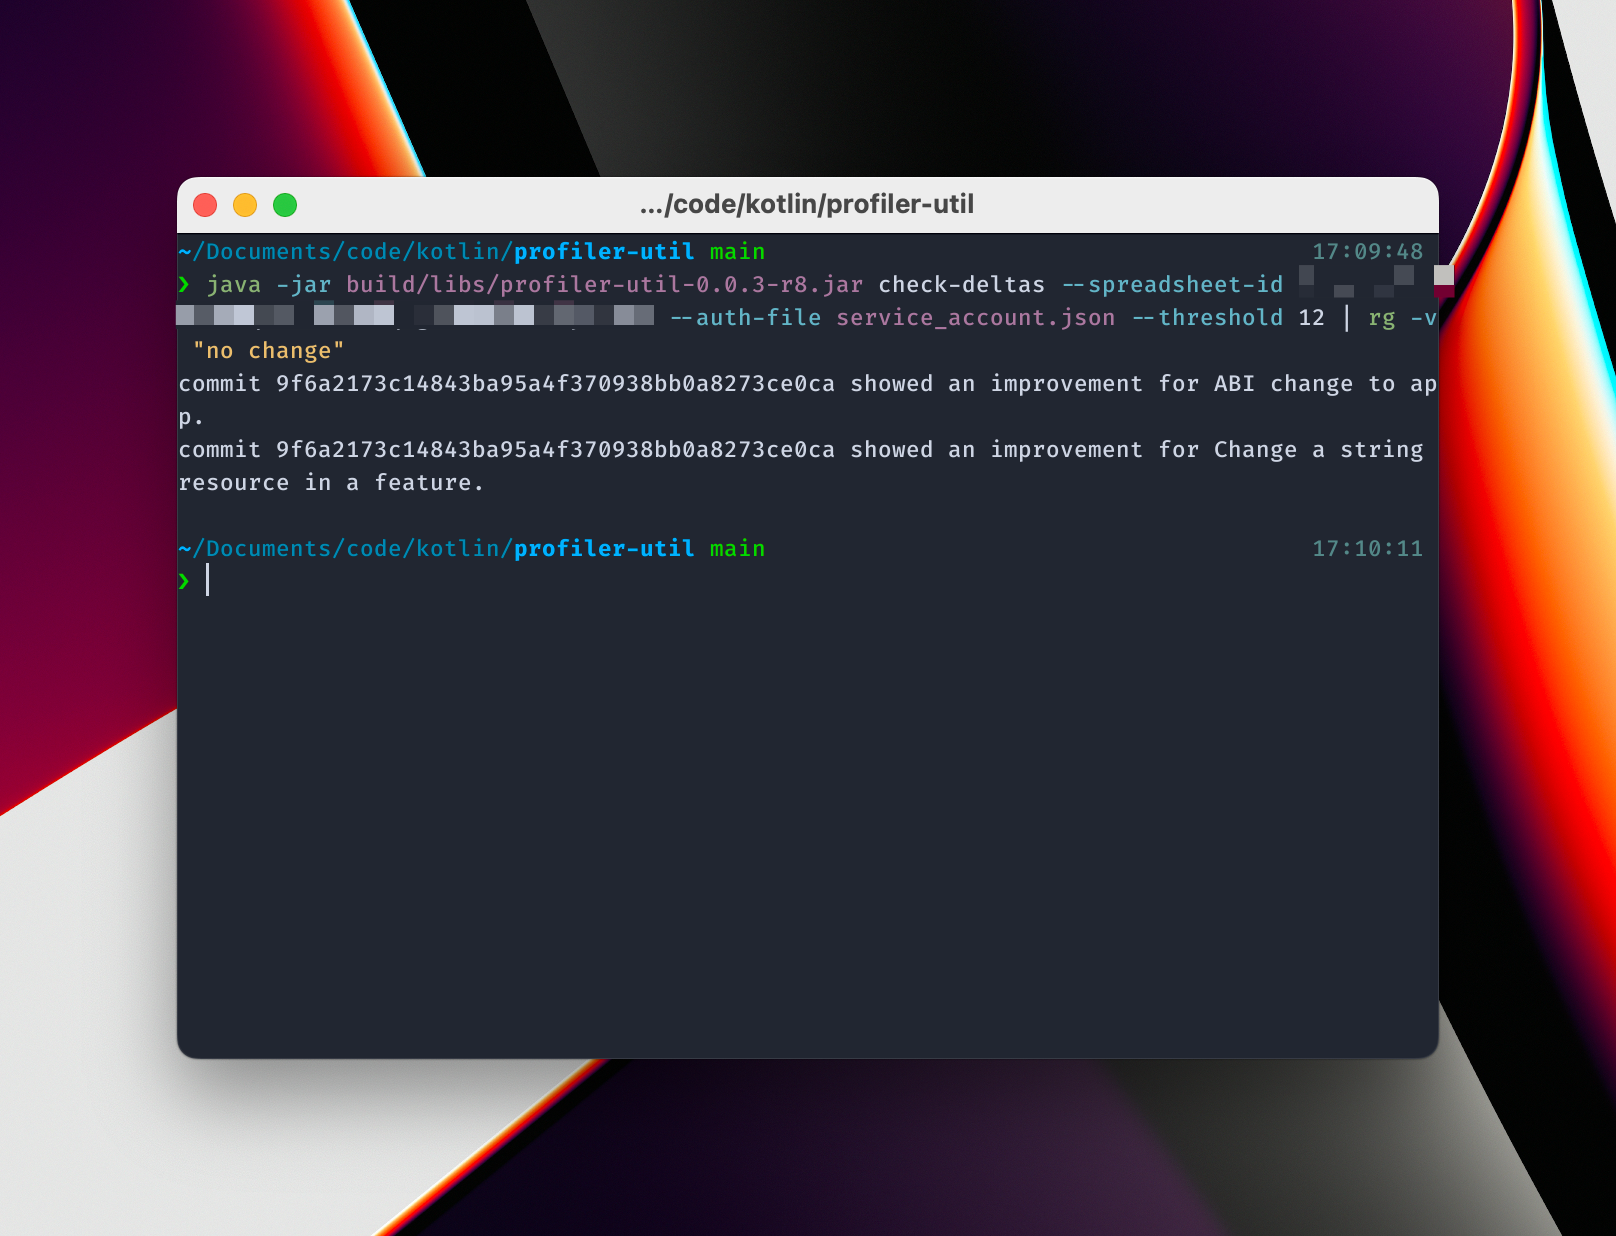
Detecting regressions
The second tool uses the step fitting method that I learned about from this excellent article about benchmarks to figure out which builds caused a regression or helped improve the build speeds. Essentially, build metrics from a single profiling run might not be enough to determine whether a change occurred or not, especially due to variations that could occur on the system running the profiling. Using the --iterations flag of gradle-profiler helps.
Note: Today, I use the average of all iteration times for a given scenario as the number I consider. Only looking at the mean causes a loss of information (and assumes the data follows a normal distribution when it doesn’t). For more accuracy, additional signals (such as median and p95) should also be considered.
Instead of using changes in a given value to determine whether or not there is an improvement or regression due to a particular PR, this tool instead uses a windowed approach to check if there is a notable difference in the build performance when a window before the commit is compared to one after the commit.
From this, we can see that the commit in which I updated to use non-transitive R files helped speed up things when adding a resource, and when making an abi change to app. Note that, while the graph shows some other potential improvements, the tool doesn’t list them because the threshold doesn’t consider them as substantial as the other changes reported.
Where to Run Benchmarks
When I began this process, I made an initial mistake, thinking that I could run these tests as part of CI on every pull request or merge of code. Unfortunately, after trying it out, the numbers were all over the place. In retrospect, this makes sense - there are no guarantees about the VMs or machines that a particular provider is using for running these builds, how loaded the physical hardware is, and so on. Moreover, running these profiling builds on CI typically takes forever. The combination of all of these can cause a great deal of variance. It is worth noting, however, that some measures can be taken to make this data more usable - using bare metal instances instead of virtual machines, for example, or running a massive number of builds such that outliers can be smoothed out can both help.
Instead, I settled on running these on my own laptop after making changes that I think would be relevant data points to have. In the future, I could probably rent a dedicated, bare metal server or purchase a dedicated machine and run these tests on a cron, but given that these are personal projects, it’s probably overkill at this point.
Conclusion
In the future, it’d be nice to change this to allow various data export methods - instead of writing to Google Sheets, have an option to write to a database, for example. The Google Sheets integration piece is also interesting, since it can be used for quick visualizations of other pieces of data - apk size and macro/micro benchmark results (though this post from the performance-samples project might be the way to go on this one). Please feel free to share your ideas or feature requests on the GitHub project.
Special thanks to Tony Robalik and Efeturi Money for reviewing this post and giving valuable suggestions.
I wanted to write a short post about how to find the reason for a particular version of a dependency to be selected by Gradle.
Today, while building our app, we started getting this error:
The minCompileSdk (31) specified in a
dependency's AAR metadata (META-INF/com/android/build/gradle/aar-metadata.properties)
is greater than this module's compileSdkVersion (android-30).
Dependency: androidx.core:core:1.7.0-alpha02.
AAR metadata file: /Users/ahmedre/.gradle/caches/transforms-3/3a90b660583f6aafd513bafe95732d86/transformed/core-1.7.0-alpha02/META-INF/com/android/build/gradle/aar-metadata.properties.
The error makes sense, but my question was, “who pulls in androidx.core:core:1.7.0-alpha02 - we shouldn’t be using alpha dependencies at the moment, so where is this coming from?”
The first place to look was through Gradle’s dependency target -
Looking through this, I can see indeed that androidx.core:core is being updated from various other versions to 1.7.0-alpha02, but I don’t know why. I did some searching, and today I learned about the dependencyInsight target. Quoting the Gradle documentation:
The dependencies report provides you with the raw list of dependencies but does not explain why they have been selected or which dependency is responsible for pulling them into the graph.
This is the culprit! The publisher of this dependency seems to have added an androidx.core:core-ktx:+ dependency. I checked and this was indeed the case. Mystery solved!
The next question was, how do we avoid having this happen again? Some more searching lead me to this post in the Gradle documentation, which suggests the usage of the failOnDynamicVersions(). We can also prevent snapshots by doing failOnChangingVersions(). Awesome!