Visualizing Gradle Build Perf Over Time
Jun 12, 2022 · 4 minute readcode
androidgradle
Monitoring Gradle Build Speeds for Smaller Projects
Today, there are many great articles and videos about how to optimize Gradle performance for Android builds. Larger companies watch these metrics closely, since build time translates into money. These two comics sum up the situation pretty nicely.
I write and maintain several of my own Android applications. This got me to thinking about my own app build times. I started off using the gradle profiler, as recommended by many of the aforementioned articles and videos (this article gives a nice introduction on how to use the gradle-profiler in the light of Android apps).
Having a way to measure is great, but how do I know how my build times are doing over time? I wrote and open sourced profiler-util, a Kotlin app, for just this purpose.
Visualizing Build Performance over Time
After running a gradle-profile, one of the outputs is a benchmark.csv file with the format. The tool I wrote has two modes - the first uploads the results from the benchmark.csv file into a Google Sheets spreadsheet.
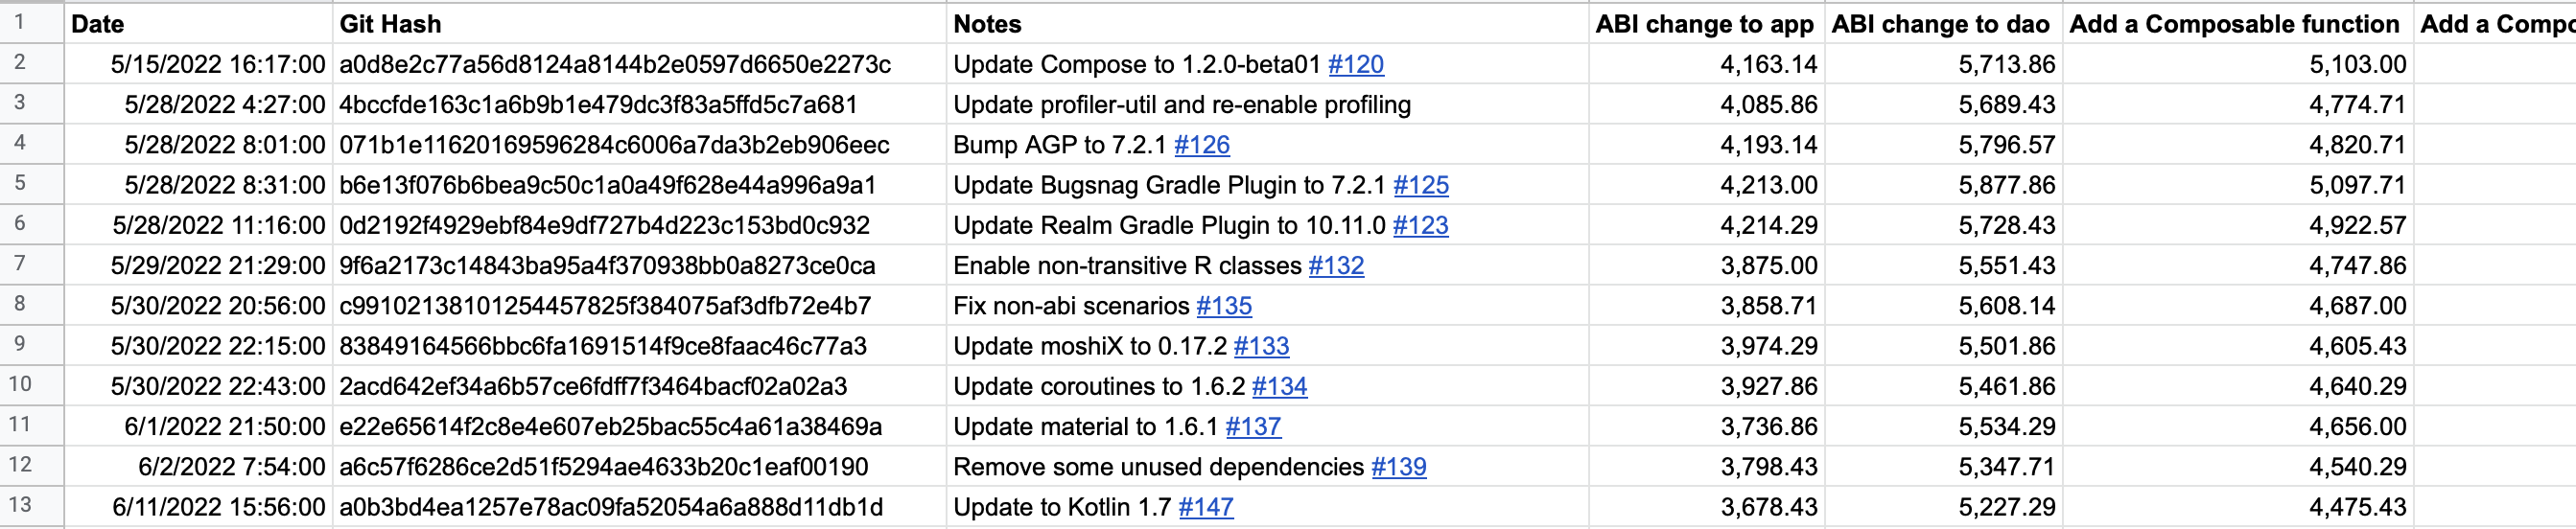
What’s nice about using Google Sheets is that we also get graphing out of the box:
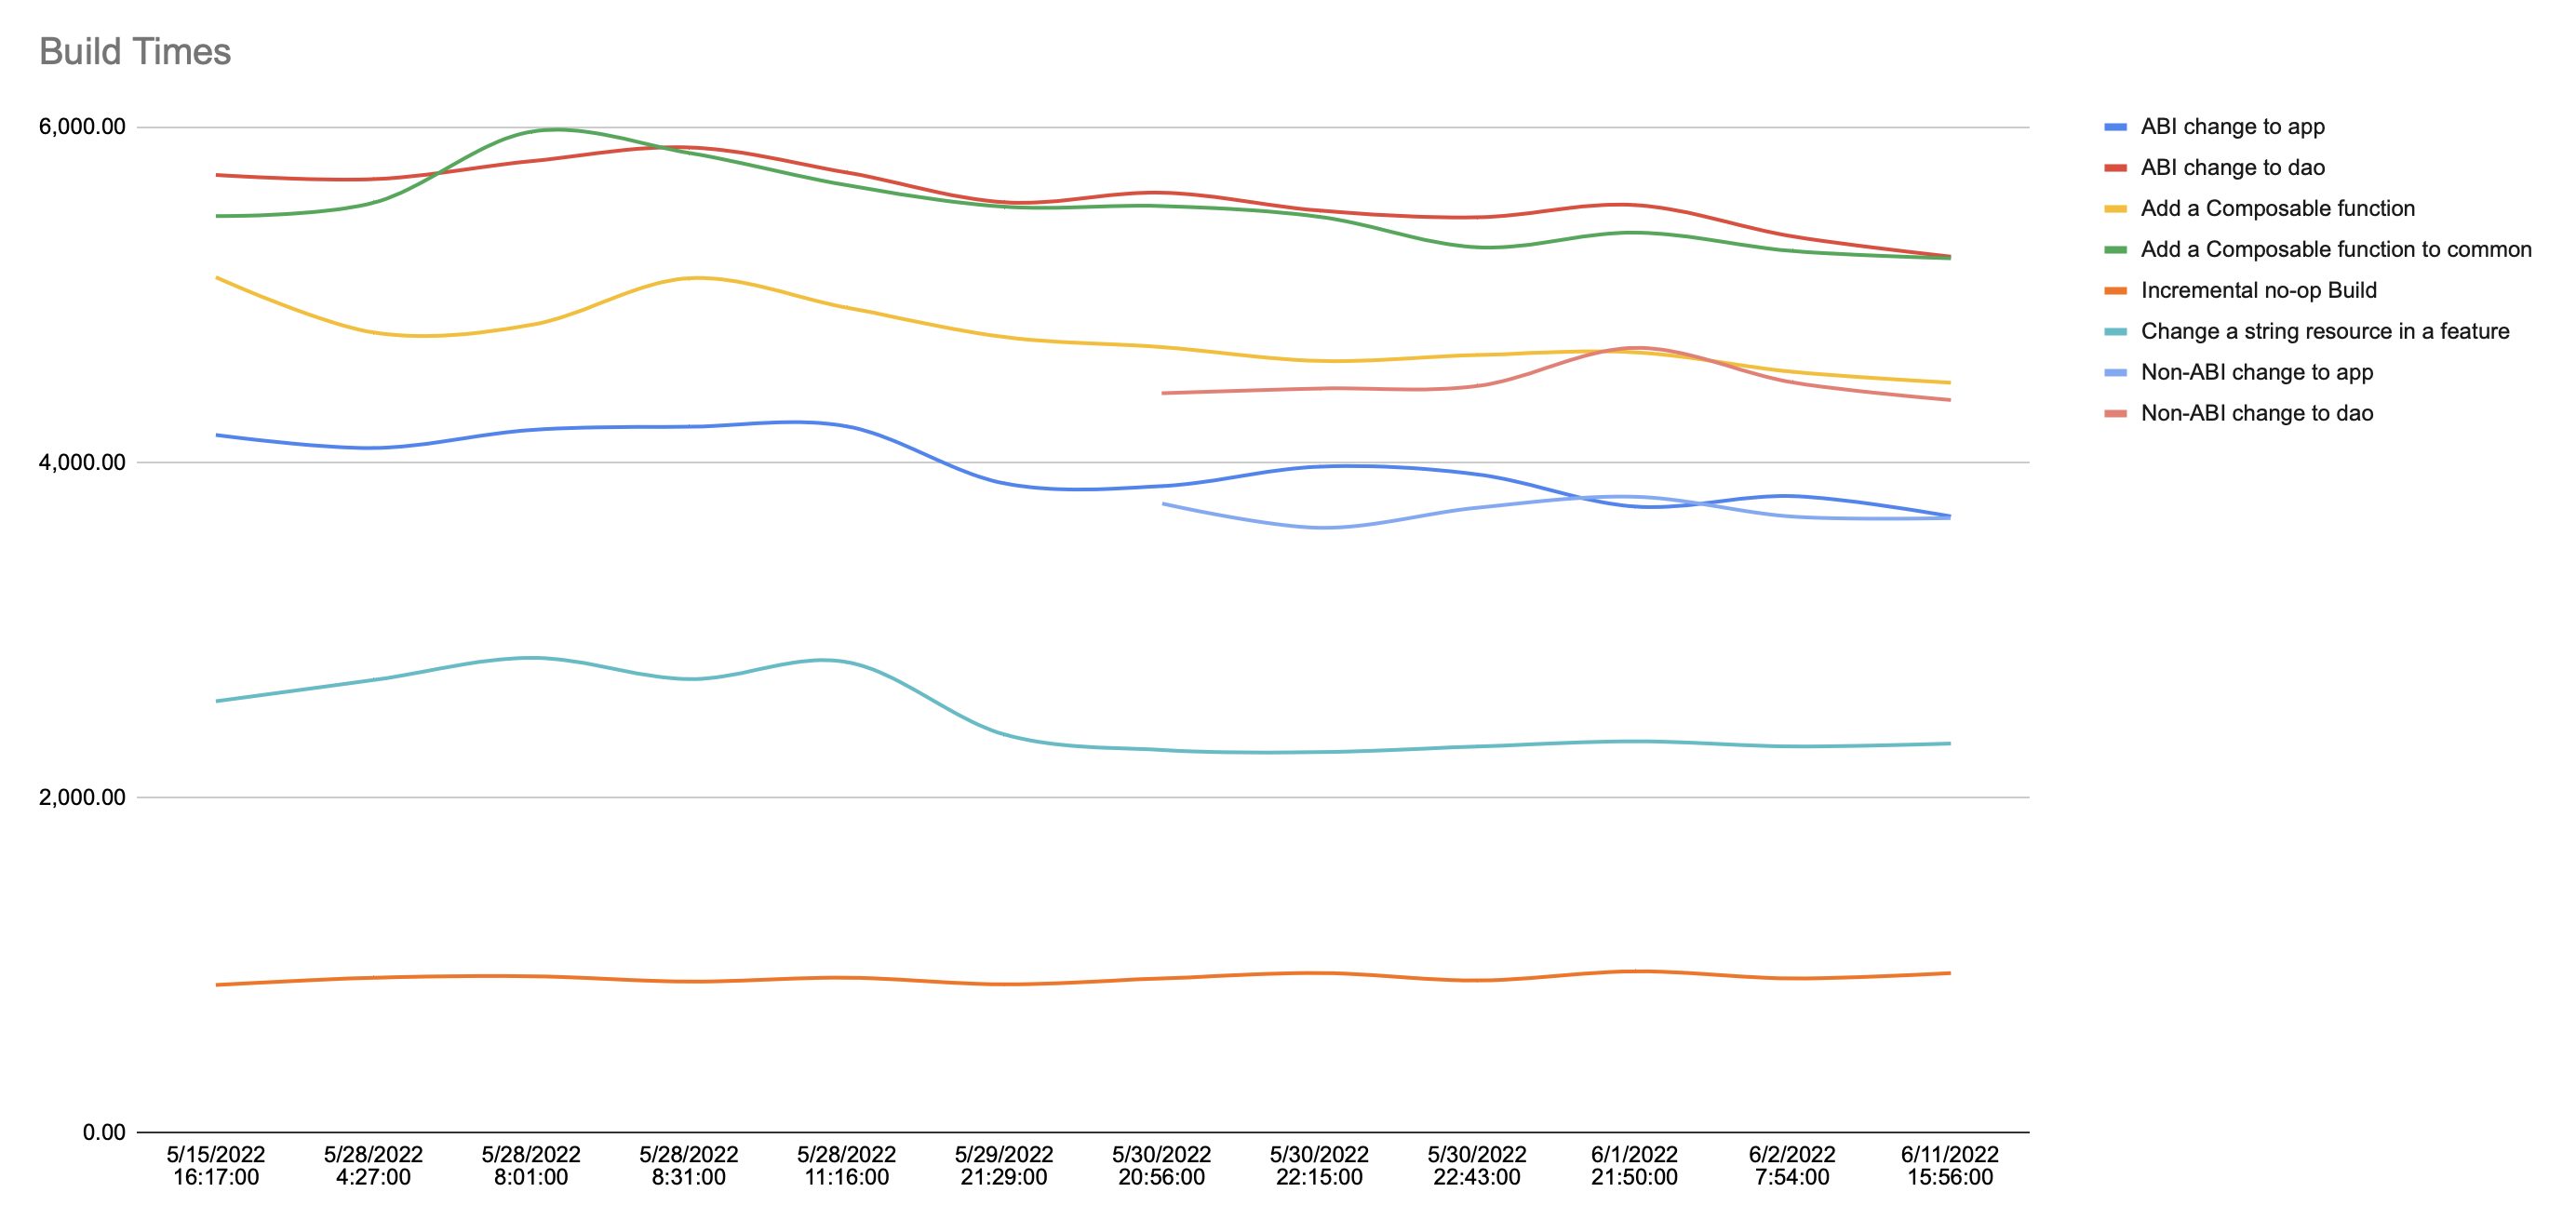
Note that the incomplete lines are benchmarks I added later on.
Detecting regressions
The second tool uses the step fitting method that I learned about from this excellent article about benchmarks to figure out which builds caused a regression or helped improve the build speeds. Essentially, build metrics from a single profiling run might not be enough to determine whether a change occurred or not, especially due to variations that could occur on the system running the profiling. Using the --iterations flag of gradle-profiler helps.
Note: Today, I use the average of all iteration times for a given scenario as the number I consider. Only looking at the mean causes a loss of information (and assumes the data follows a normal distribution when it doesn’t). For more accuracy, additional signals (such as median and p95) should also be considered.
Instead of using changes in a given value to determine whether or not there is an improvement or regression due to a particular PR, this tool instead uses a windowed approach to check if there is a notable difference in the build performance when a window before the commit is compared to one after the commit.
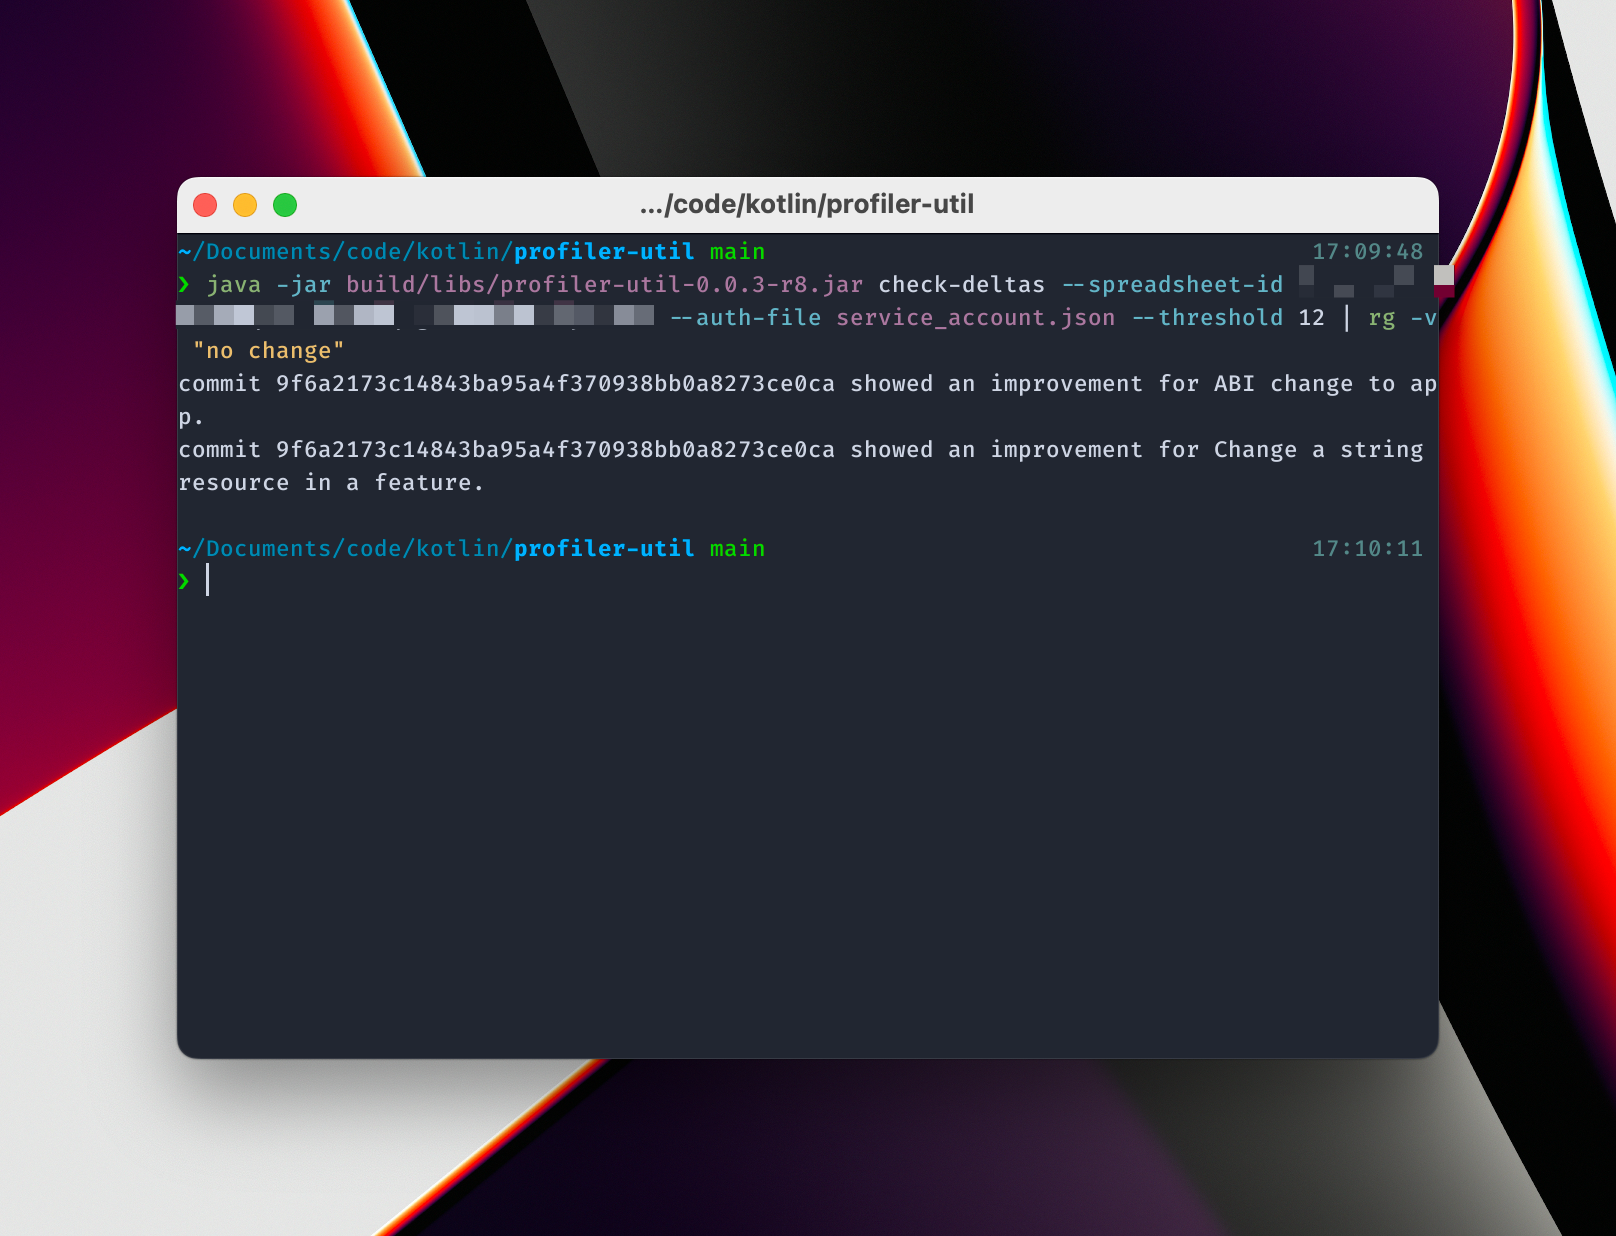
From this, we can see that the commit in which I updated to use non-transitive R files helped speed up things when adding a resource, and when making an abi change to app. Note that, while the graph shows some other potential improvements, the tool doesn’t list them because the threshold doesn’t consider them as substantial as the other changes reported.
Where to Run Benchmarks
When I began this process, I made an initial mistake, thinking that I could run these tests as part of CI on every pull request or merge of code. Unfortunately, after trying it out, the numbers were all over the place. In retrospect, this makes sense - there are no guarantees about the VMs or machines that a particular provider is using for running these builds, how loaded the physical hardware is, and so on. Moreover, running these profiling builds on CI typically takes forever. The combination of all of these can cause a great deal of variance. It is worth noting, however, that some measures can be taken to make this data more usable - using bare metal instances instead of virtual machines, for example, or running a massive number of builds such that outliers can be smoothed out can both help.
Instead, I settled on running these on my own laptop after making changes that I think would be relevant data points to have. In the future, I could probably rent a dedicated, bare metal server or purchase a dedicated machine and run these tests on a cron, but given that these are personal projects, it’s probably overkill at this point.
Conclusion
In the future, it’d be nice to change this to allow various data export methods - instead of writing to Google Sheets, have an option to write to a database, for example. The Google Sheets integration piece is also interesting, since it can be used for quick visualizations of other pieces of data - apk size and macro/micro benchmark results (though this post from the performance-samples project might be the way to go on this one). Please feel free to share your ideas or feature requests on the GitHub project.
Special thanks to Tony Robalik and Efeturi Money for reviewing this post and giving valuable suggestions.