Fixing Build Regressions
Sep 24, 2022 · 5 minute readcode
androidgradle
In a previous article, I talked about writing profiler-util, a tool I open sourced for visualizing build performance over time for personal projects (it interops the files generated by gradle-profiler and uploads the data to a Google Spreadsheet, along with providing tools for detecting regressions).
I typically run gradle-profiler on my personal projects every handful of PRs, especially those that I expect might affect build speeds (Gradle plugin versions, AGP versions, compiler plugins, etc).

The scenarios file I use for gradle-profiler consists of a number of cases, including abi and non-abi changes to app and non-app modules, changing resources, adding a composable function, clean builds using build cache, and configuration (see this page from the Android developer documentation and the gradle-profiler readme for more details).
A Mysterious Situation
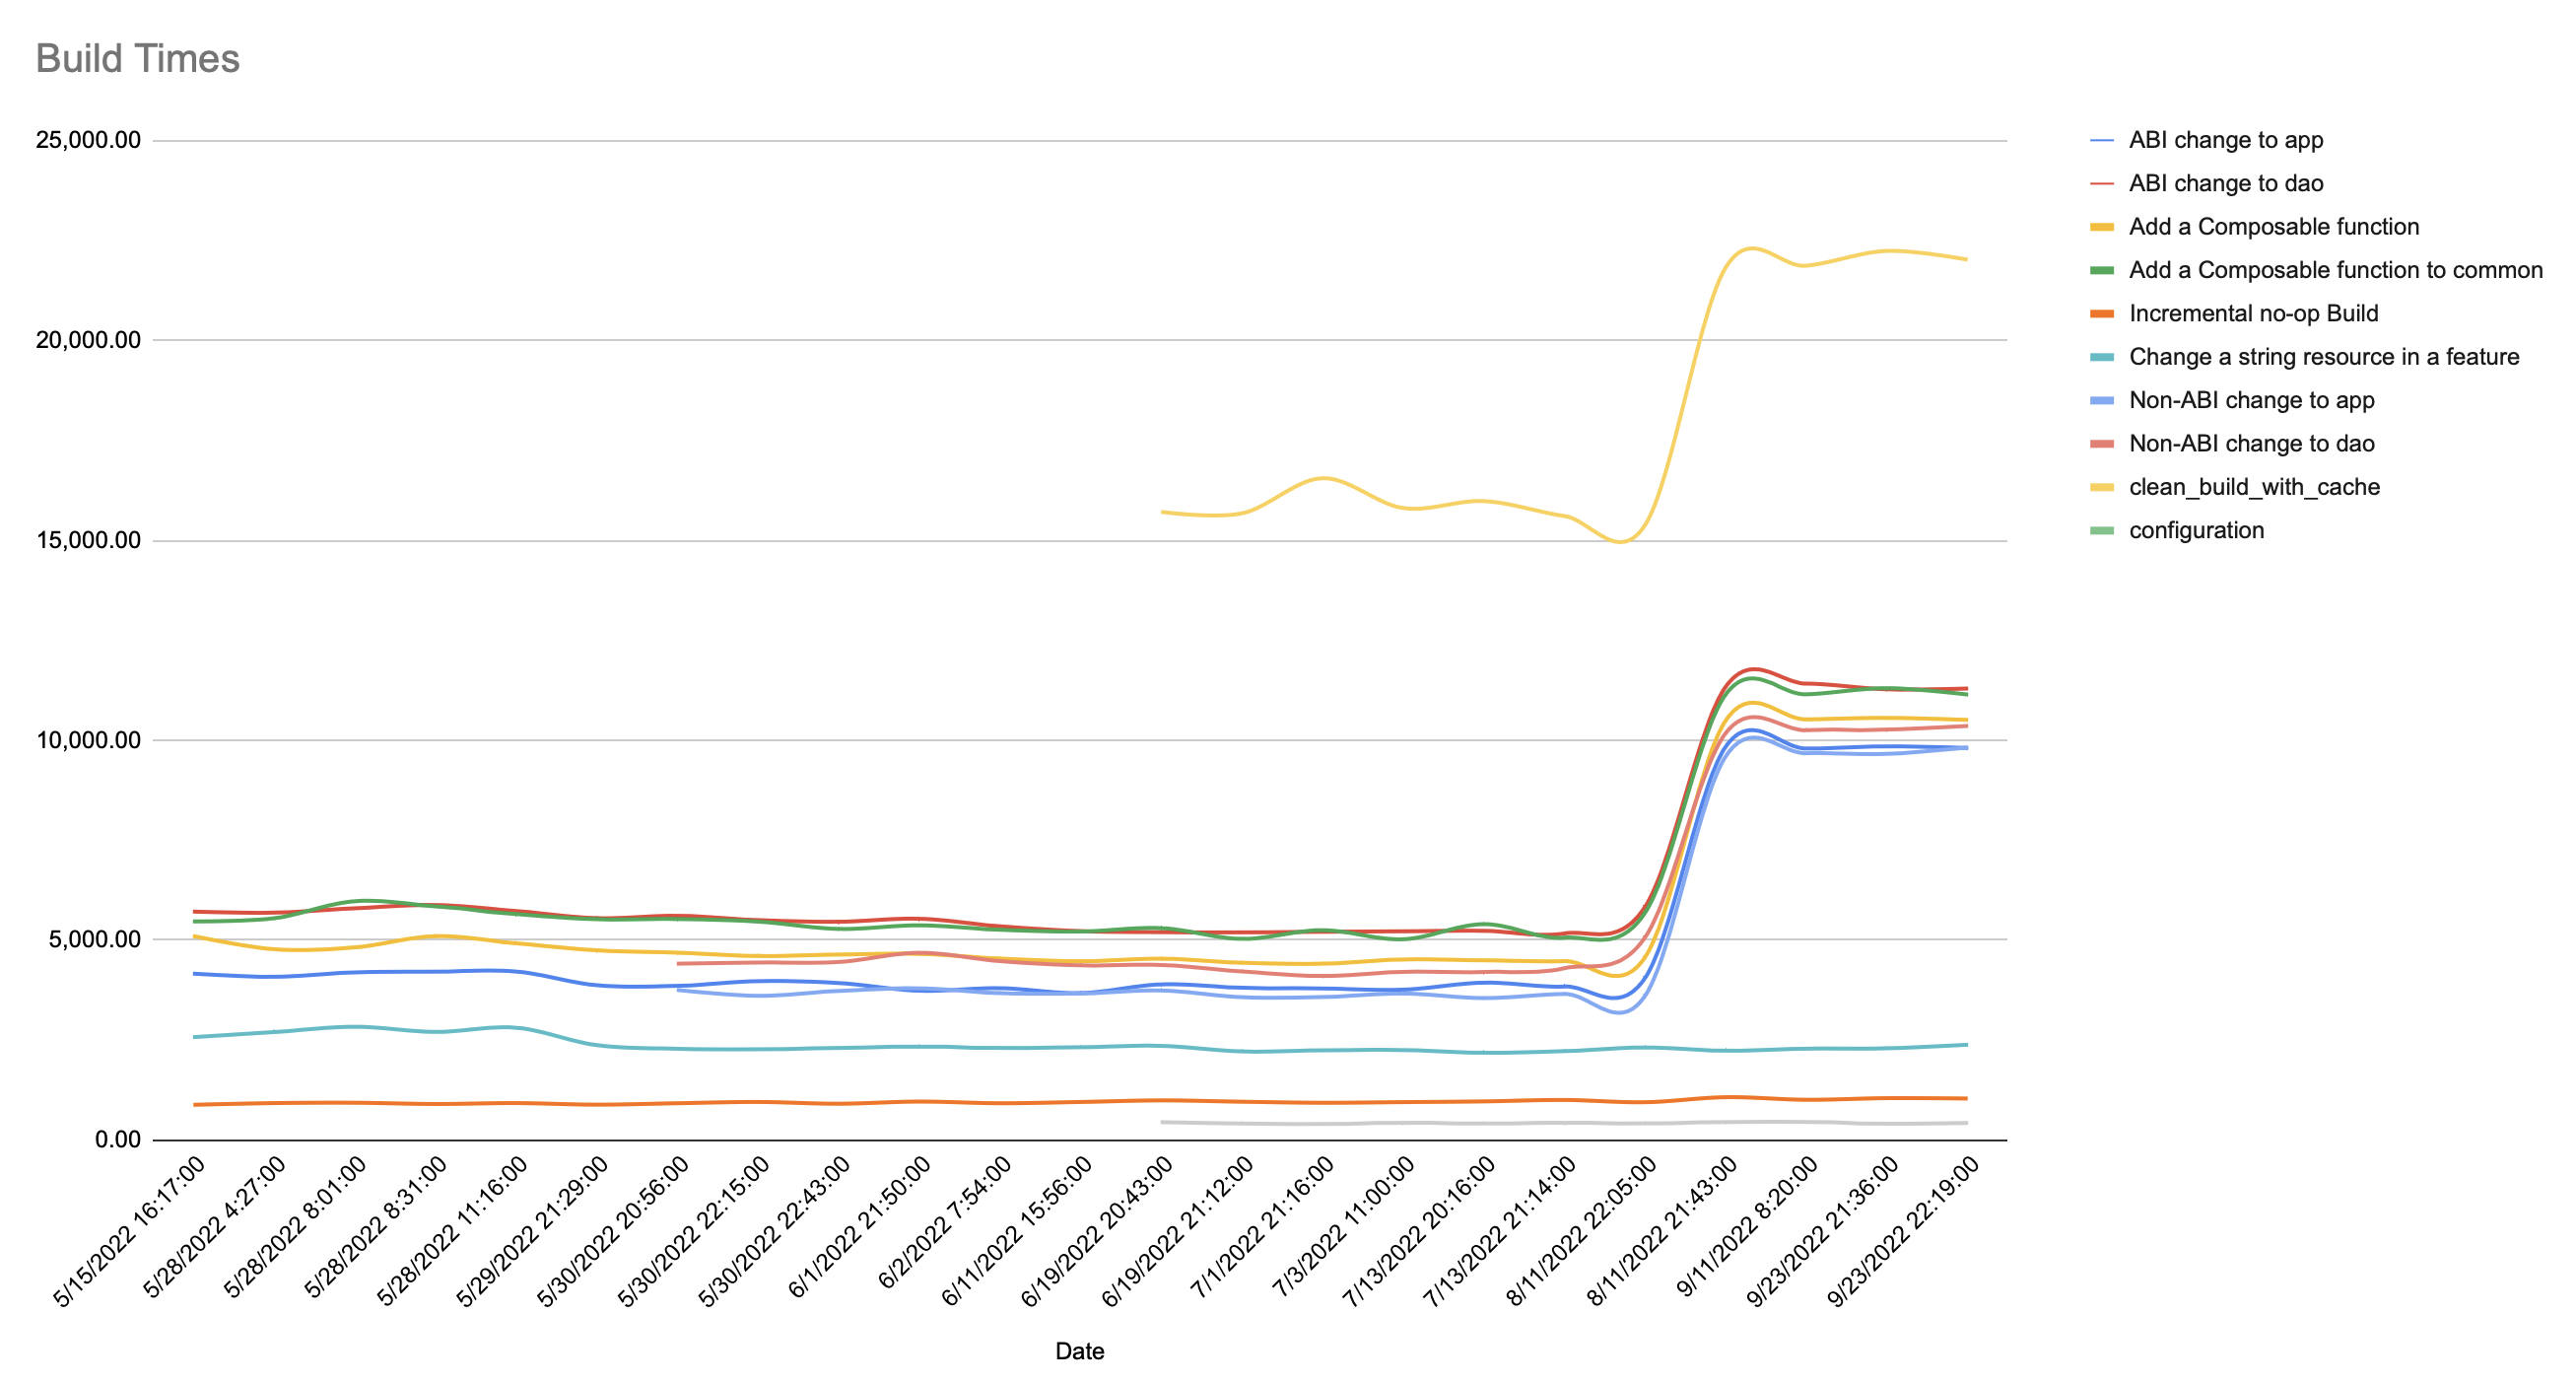
Recently, I checked to see how the build performance for my app was doing, and was surprised to see this:

Looking closer, I could see the times greatly increasing for all but 3 metrics - configuration change, the change of a resource, and an incremental build without having changed any code. Given this, I looked and found that the change was upgrading AGP from 7.2.1 to 7.2.2 in this project. Surprised, I checked my other projects, and none of them had the same issue. A few weeks later, when I upgraded to AGP 7.3.0, the build times still didn’t improve, which surprised me.
I decided to look into this to try to figure out what was happening.
Thinking about Potential Explanations
Given that this was only happening in this project and none of my other projects, I decided to look into one of the following initial potential explanations:
- Maybe nothing was wrong and re-running the test would fix the issue.
- Gradle configurations across the profiler are different than those in real life - maybe there is no regression at all and is just a case of mismatched properties?
- This project uses Realm, whereas none of my other projects do. Could this be related?
Going through these quickly:
- I re-ran the test multiple times on the commit with AGP 7.2.1 and the commit with the single change to AGP 7.2.2 and got consistent results every time. So much for that idea.
- I chose one of the cases above,
clean_build_with_cache, and ran it without gradle-profiler (./gradlew clean; ./gradlew assembleDebug) with AGP 7.2.1 and again with AGP 7.2.2 to eyeball the results - once again, they seemed consistent with the profiler results, thus removing the mismatched properties as an explanation. - An update to Realm happened recently and it unfortunately didn’t change the numbers at all. Moreover, no upgrade to Realm had happened in the window before the upgrade.
Finding the Issue
Given that none of the above worked, I decided to try something else that
ultimately lead me to the problem - I ran the above clean_build_with_cache
commands locally with --profile for both AGP 7.2.1 and AGP 7.2.2:
git checkout <last commit with 7.2.1>
# warm up caches, etc due to AGP version change to 7.2.1
./gradlew clean
./gradlew assembleDebug
./gradlew clean
./gradlew assembleDebug --profile
git checkout <first commit with 7.2.2>

# note that profile html output files survive gradle clean

# warm up caches, etc due to AGP version change to 7.2.2
./gradlew clean
./gradlew assembleDebug
./gradlew clean
./gradlew assembleDebug --profile
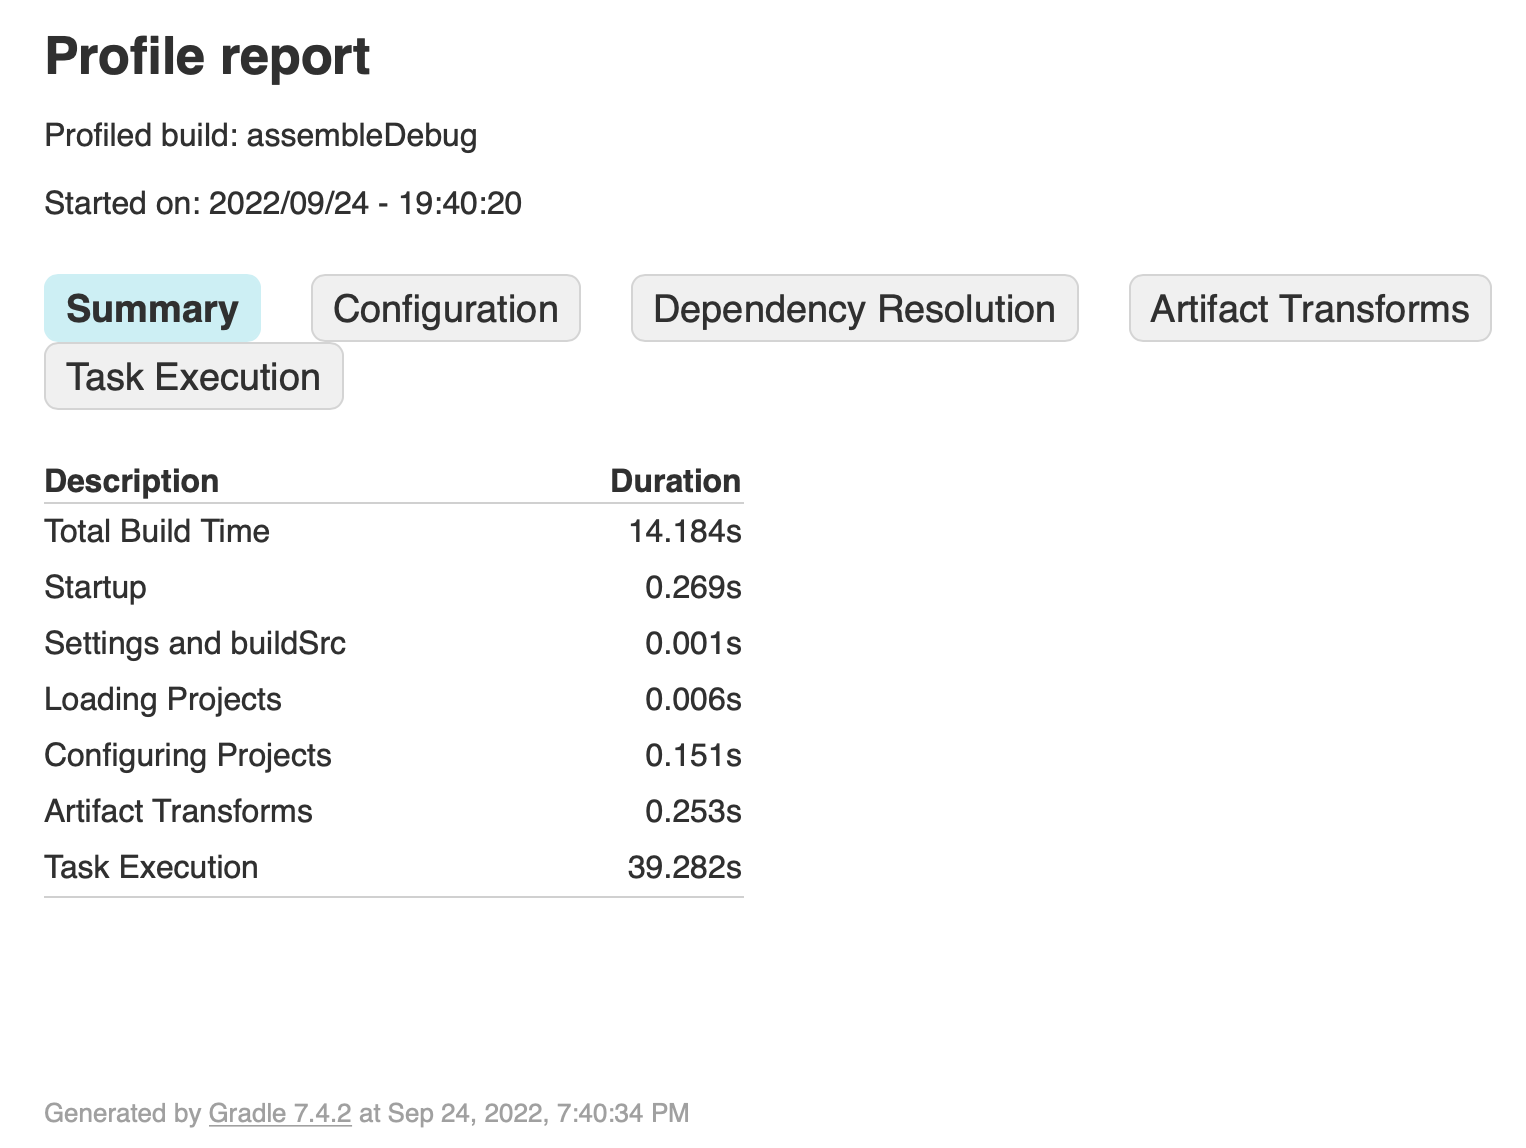
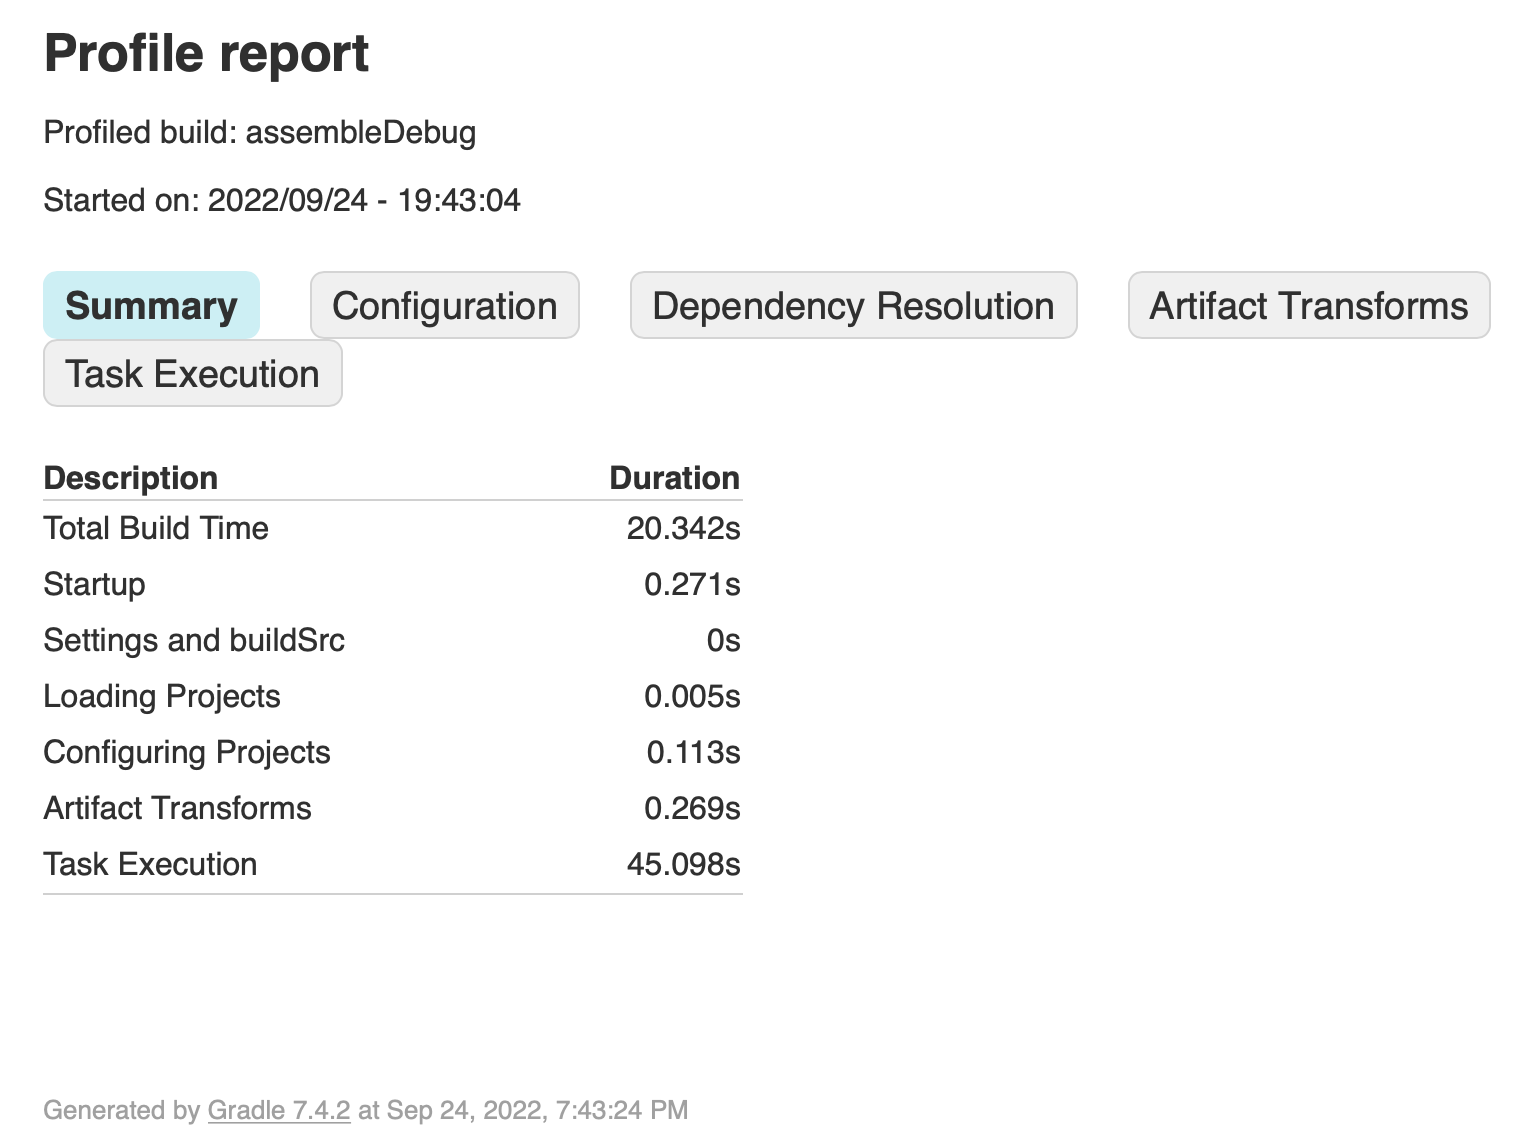
I then compared the result files:


The delta in build times is the only thing that stands out. Going through the configuration, dependency resolution, and artifact transforms tabs, nothing stands out and all numbers are close to each other.
This leaves the task execution tab, which shows us something interesting:


Why is Realm taking 6 seconds when using 7.2.2 but not when using 7.2.1? And what’s Realm’s processor doing in app?
The Culprit
Realm objects have various annotations (@RealmModule on module classes, @PrimaryKey for primary keys, @Index for indices, etc), and requires an annotation processor, bundled within a realm-android plugin.
Historically, I had all said annotated classes in a separate, standalone module just for Realm models, since I know they’d rarely change and I didn’t want to pay the price of said processor every time. This is a good optimization in said cases.
Indeed, looking at app/build.gradle, I found the realm-android plugin in use there. So how did it get to app? Apparently, sometime back in May of 2016, io.realm imports were not resolving in the app module anymore (by not resolving, I am guessing this was in the IDE and not actually at compile time, though today, I have no way of being sure).
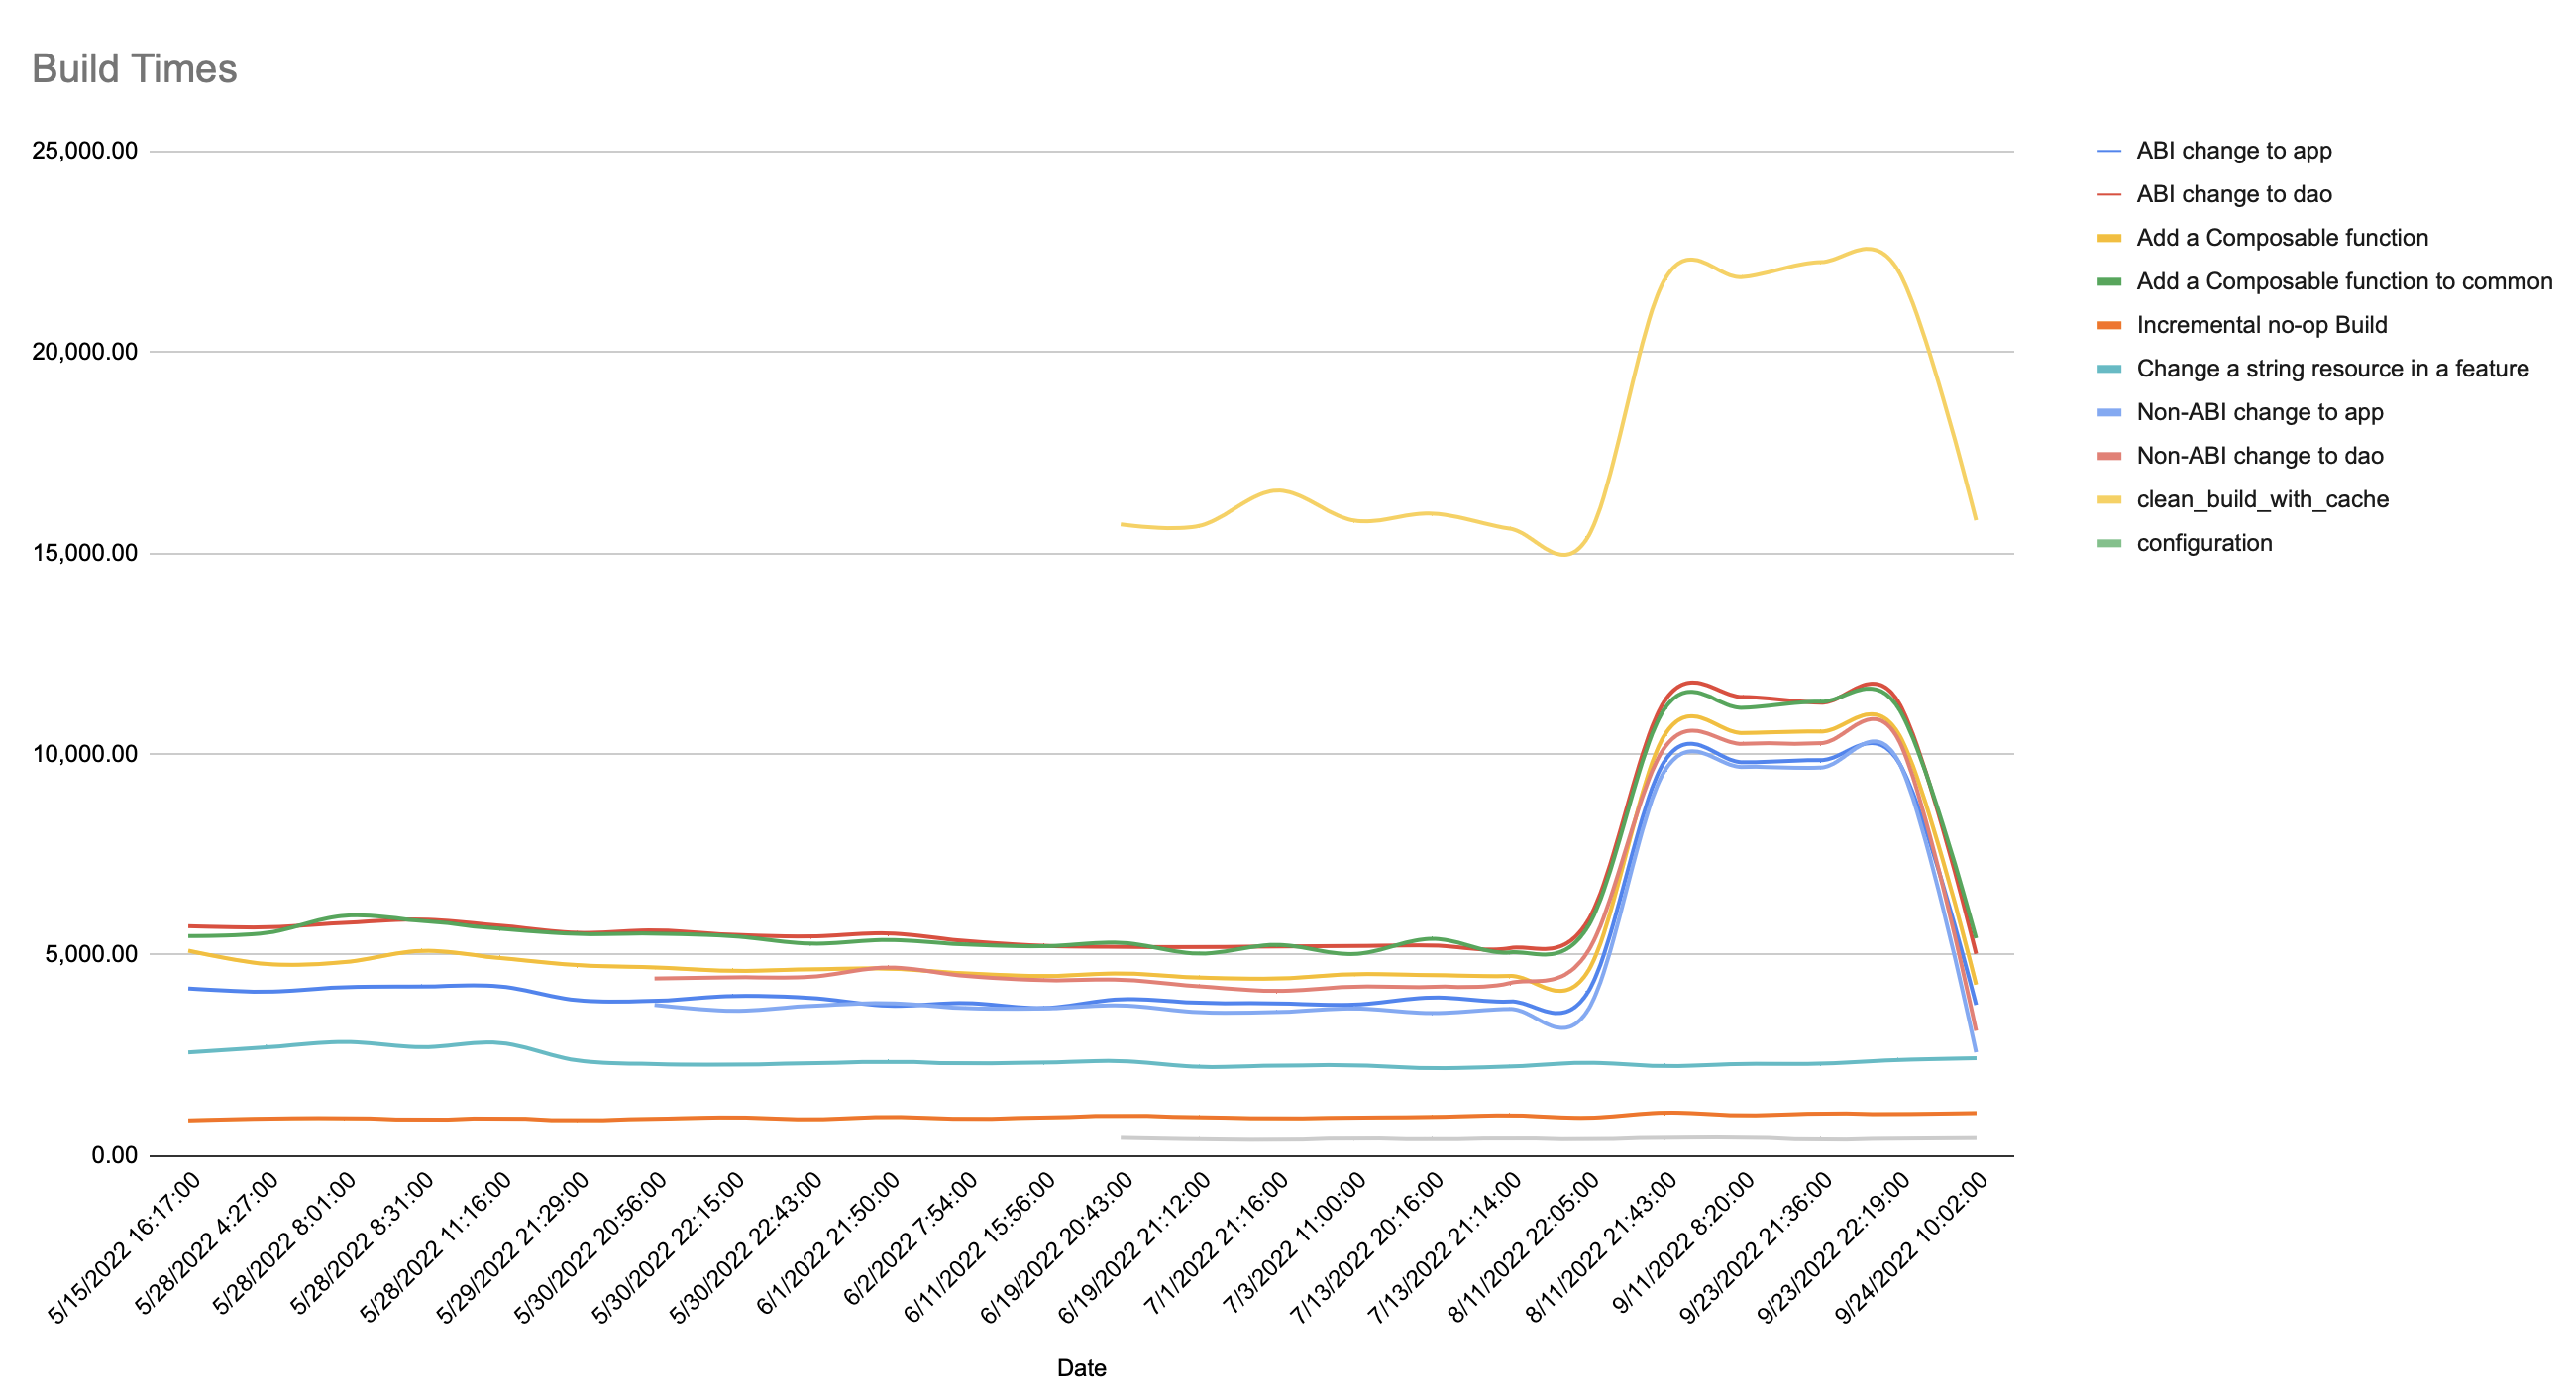
Removing the realm-android plugin brings back the compilation times to what they were before AGP 7.2.2 and above. This, however, doesn’t explain what AGP 7.2.2 had to do with this.

Warning - this is purely speculation at this point, and I am not certain about anything else in this paragraph. Looking at the release notes for 7.2.2, there are only 2 fixes there. One of them is this one, which has to do with fixing a bug related to the transform API when used with the ASM api. ASM is used for bytecode manipulation, and is in use by realm-android. I suspect that this bug caused the plugin to do nothing in app (which was fine since it’s technically not needed as mentioned above). The bug was introduced in 7.2 alpha, and wasn’t fixed until 7.2.2. The first commit in my profiling was using 7.2.0, so I never noticed any “improvement” between 7.1.x and 7.2.x, only to see it being lost again in 7.2.2. This is, however, only a guess.
Wrapping Up
Some takeaways here:
- Monitor your build times - the results may be quite surprising.
- gradle-profiler is your friend.
- the
--profileflag is your friend. - If none of this had worked, I would have resorted to running a build scan next.